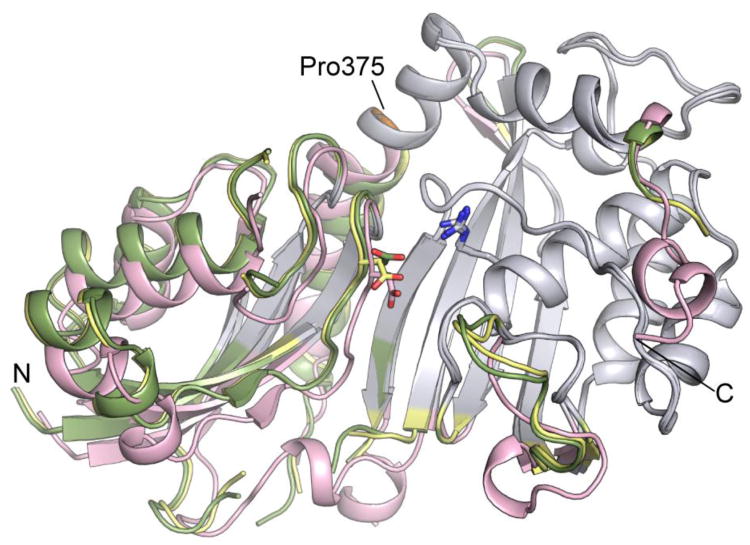
Figure 3.
Conformational changes between Pus1 form I (MES, apo) and form II (apo) crystal structures. The conserved cores of the C-terminal domains of the three Pus1 structures were superposed (colored grey). Form I (MES) is colored in yellow. Form I (apo) in green shows a narrowed active site cleft, and form II (apo) in salmon shows a crystal-form dependent rigid body shift in the N-terminal domain. Catalytic Asp146 and Arg295 are represented as sticks. Pro375 is colored orange. The orientation shown corresponds to the orientation shown in Figure 1 A left panel.

