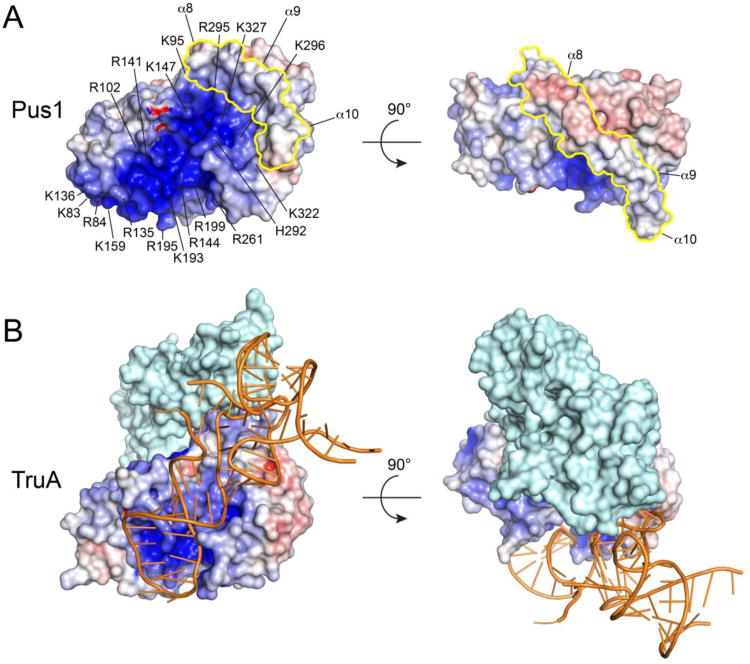
Figure 5.
Electrostatic surface potentials of apo-Pus1 (form II) (A) and TruA from the tRNA-TruA complex (PDB ID: 2NR0) (B). The Pus1 C-terminal insert is colored in yellow. Positive electrostatic potential is colored blue (+10 kT/e), negative electrostatic potential red (-10 kT/e). Electrostatic potentials were calculated with APBS46 Pus1 and TruA were superposed on their catalytic cores and the two orientations shown correspond to the orientations in Figure 1A. The surface of a dimer of TruA is shown with only one protomer TruA colored according to its electrostatic surface potential and the other protomer colored in light cyan. Bound tRNA is shown in orange cartoon format.

