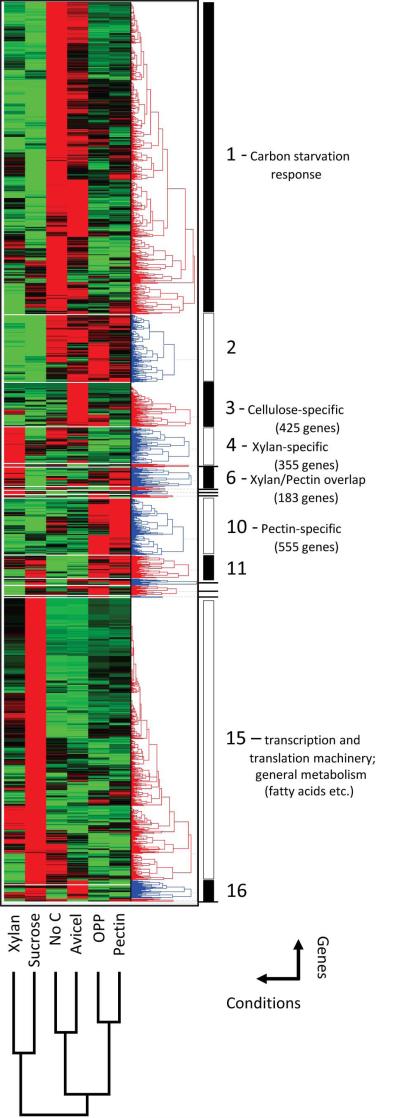
Fig. 6.
Hierarchical clustering of expression profiles for pectin, OPP, xylan, Avicel, sucrose and no carbon response. The averaged transcriptional expression profiles for the full-genome response to all three major plant cell wall polysaccharides (cellulose, xylan and pectin) as well as orange peel powder (OPP) and control conditions (no carbon and sucrose) were normalized and clustered in two dimensions: six conditions (horizontal) and ~8500 genes (vertical), using the software Hierarchical Clustering Explorer v3.0 (see also Supporting data set 4). The resulting heat map (normalized from bright green = low expression to bright red = strong expression) was divided into 17 sub-clusters. Large clusters are marked by black and white bars, while smaller clusters are indicated by short dashes. Genes with consistently low expression (<10 FPKMs in all conditions) were not included in the clustering.

