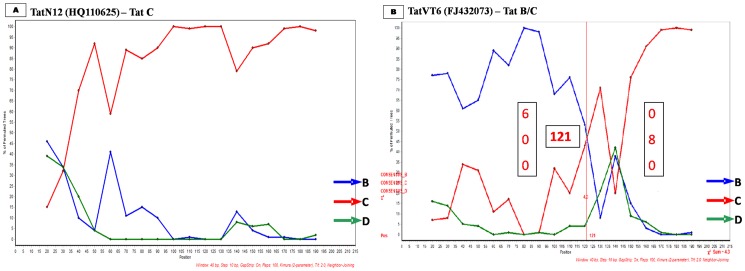
Figure 3. Breakpoints prediction at specific nucleotides.
A) TatN12 is a representative of Tat exon-1 C variant. B) TatVT6 is a representative of Tat exon-1 B/C recombinant. Bootscan analysis was performed using consensus B, C and D sequences as shown in blue, red and green arrows respectively with our variants. The X-axis represents the percentage of sequence similarity with the corresponding subtypes and the Y-axis represents the amino acid position of variant sequence. Informative site analysis of B/C recombinants suggested that the N-terminal half consisted of 6, 0 and 0 values for subtypes B, C and D respectively and the C-terminal half consisted of 0, 8 and 0 values for Tat B, C and D respectively.

