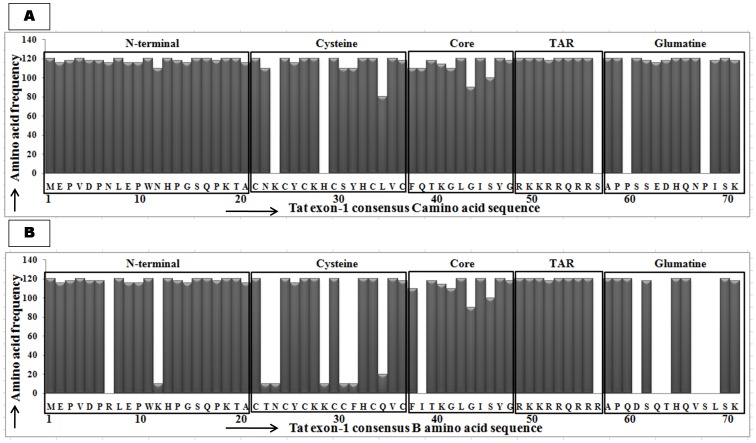
Figure 4. Tat exon-1 amino acid sequence analysis.
A) Amino acid signature pattern of Tat exon-1 variants were compared with consensus Tat B sequence. B) Amino acid signature pattern of Tat exon-1 variants were compared with consensus Tat C sequence. The X-axis represents the amino acid consensus sequence of Tat B and C with the functional domains such as N-terminal (1–21aa), Cystine rich (22–37aa), Core (38–48aa), Arginine rich (49–57aa), Glutamine rich (58–71aa) and the Y-axis represents the amino acid frequency observed in our variants.

