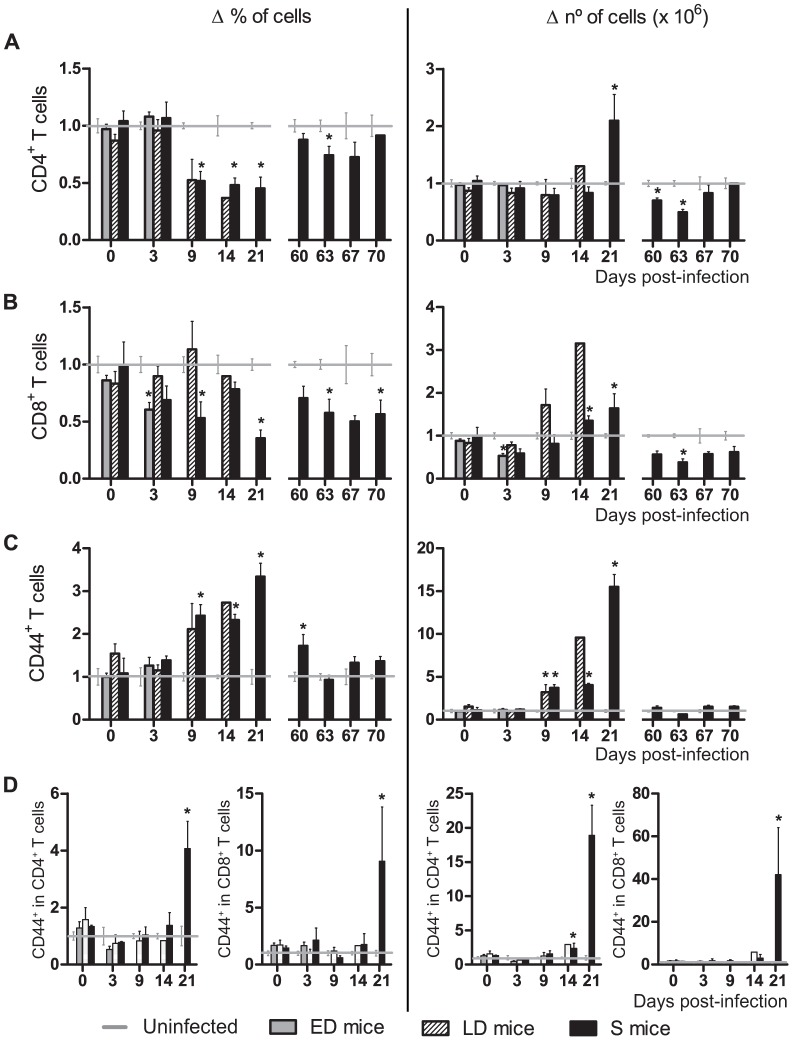
Figure 4. Kinetics of CD4 and CD8 T cells and CD44 expression in blood of PyL infected ICR mice.
WBCs were isolated from the PB of mice infected with 2×10⁷ PyL iRBCs showing different infection profiles: early deceased (ED), late deceased (LD) or surviving (S). Survivors were reinfected on day 60 pi. Frequencies (left panel) and absolute numbers (right panel) of (A) CD4 T, (B) CD8 T cells, (C) total CD44+ cells and (D) CD44+ expressing cells in CD4 and CD8 T populations. Values indicate mean (± SEM) of 2 independent experiments, each with n>3 mice per time point (except day 14 pi with only one LD mouse). The data for each infected mouse was normalized to the data recorded in 5 uninfected mice per experiment. Healthy mice had 4.53±0.12×10⁶ CD4+ cells, 1.98±0.04×10⁶ CD8+ cells and 2.89±0.19×10⁶ CD44+ cells per ml of blood. *p<0.05 with respect to uninfected mice.

