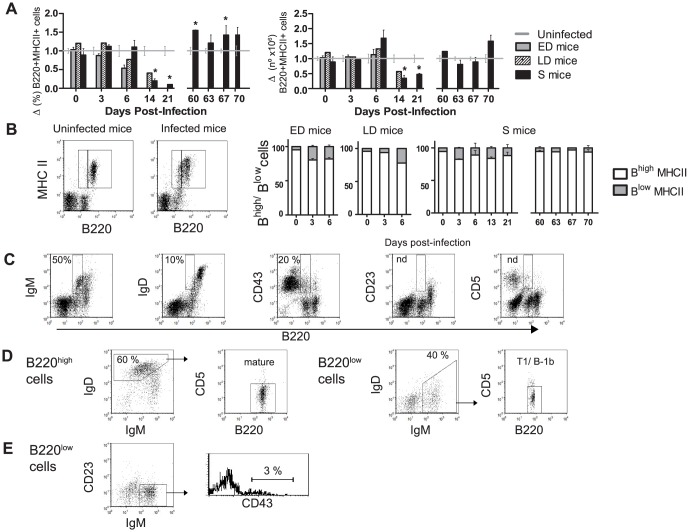
Figure 7. Blood kinetics of MHC II+ B cells and their subsets during P. yoelii 17XL infection.
ICR mice were infected with 2×10⁷ PyL iRBCs and classified as early deceased (ED), late deceased (LD) or surviving (S). Survivors were reinfected on day 60 pi. WBCs were isolated and (A) B220+ MHC II+ cells percentages and absolute numbers were normalized to data obtained in uninfected mice (n = 5 per experiment). Standard numbers of B220+ MHC II+ cells were 4.15±0.17×10⁶/ml blood. * p<0.05 with respect to uninfected mice. (B) Representative flow cytometry dot plots identifying B220low MHC II+ and B220high MHC II+ populations in infected mice. Graph shows the contribution of each subpopulation to the total number of B220+ MHC II+ cells. As uninfected mice (n = 5) maintained in all time-points same proportions as day 0, for simplicity the graphic has not been shown. (A, B) Data express mean (± SEM) of 2 independent experiments,each with n>3 mice per time point. (C) Dot plot showing IgM, IgD, CD43, CD23 and CD5 expression in B220low cells. (D) Identification of mature (IgMlow IgD+ CD5−) and T1 and B-1b cells (IgD− IgM+ CD5−) in B220high and B220low cell gates. (E) In the B220low cell gate, B-1 cells (CD23− IgM+ CD43+) were distinguished. (C, D, E) Representative percentages of measures in 2 independent experiments (n = 10).

