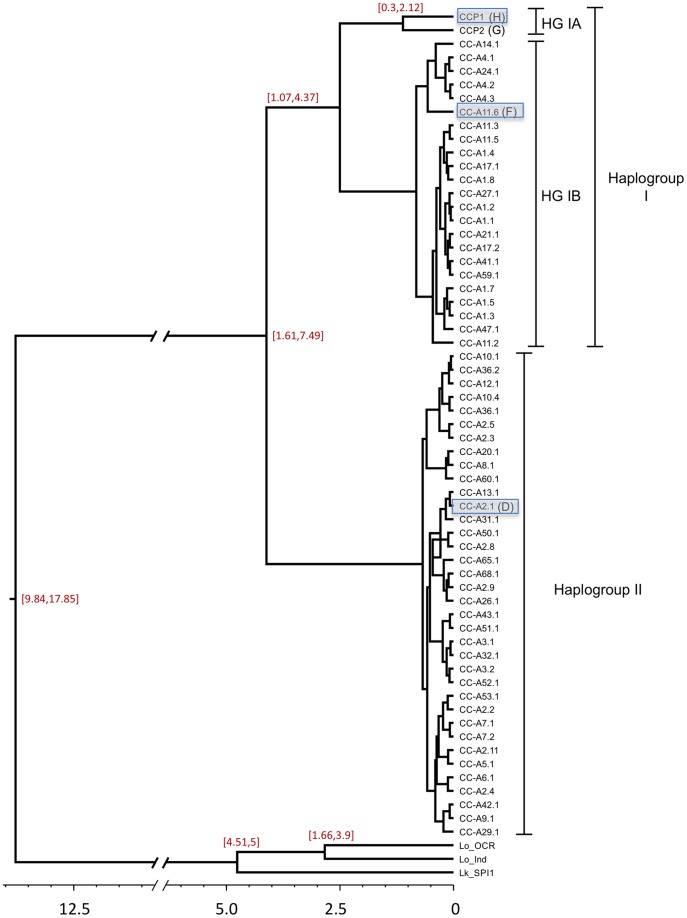
Figure 3. Chronogram for loggerhead turtle 800 base pair control region haplotypes based on a Bayesian relaxed-clock model as implemented in BEAST.
The x-axis indicates divergence times in million years before present. 95% highest posterior density (HPD) intervals are indicated for major tree nodes. RFLP haplotype names [13] are included in parentheses beside their sequence-based haplotype designations. Haplotypes present in Indian Ocean rookeries are shaded in blue.

