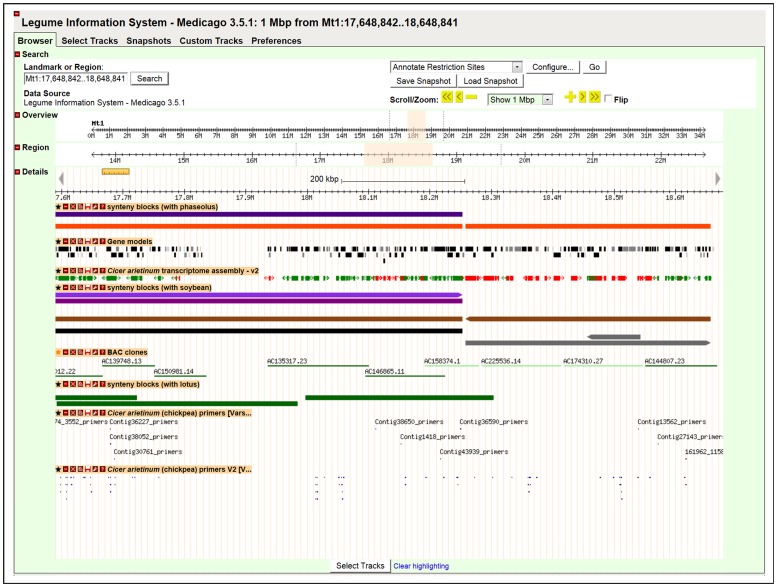
Figure 4. A sample view of chickpea TACs, markers and candidate ISR markers onto Medicago Genome sequence.
This image is from Legume Information System (LIS) GBrowse viewer at http://medtr.comparative-legumes.org/gb2/gbrowse/3.5.1/, shows 1 Mb (17,648,842.18,648,841 of Medicago, chromosome Mt1). Red: There was at least one additional reported CaTA v2 alignment Green: There were no other reported alignments.

