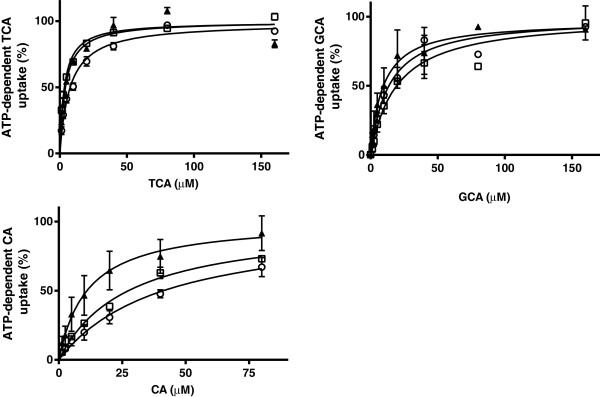
Figure 4.

ATP-dependent transport of TCA, CA and GCA in membrane vesicles (7.5 μg protein) expressing BSEP/Bsep of human (▲), dogs (□), and cats (○). Vesicles were incubated in 10 mMTris Base buffer (pH 7.4) containing 250 mM Sucrose, 10 mM MgCl2 and 4 mM ATP or AMP, at 37°C for 5 min (TCA) or 7.5 min (CA and GCA). ATP-dependent transport was calculated by subtracting transport in presence of AMP from that in presence of ATP. Curves were fitted by GraphPad Prism 6.01 software (San Diego, California, USA) and Vmax was calculated. Measurements were performed in duplicate in at least three independent experiments. The mean of the duplicates of each experiment was transformed as a relative activity to the Vmax (=100%). Each value in the graph is the mean ± SD of the relative activities of three independent experiments.
