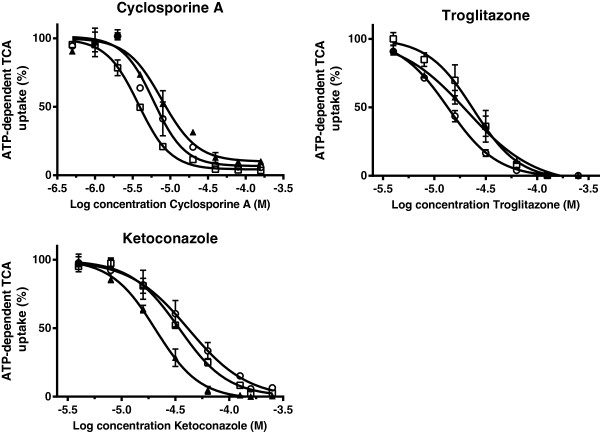
Figure 6.
Inhibition of cyclosporine A, troglitazone and ketoconazole on the uptake of 1 μM [3H]TCA in membrane vesicles (7.5 μg protein) expressing human (▲), dog (□) and cat (○) BSEP/Bsep. Vesicles were incubated in 10 mMTris Base buffer (pH 7.4) containing 250 mM Sucrose, 10 mM MgCl2 and 4 mM ATP or AMP, at 37°C for 5 min. ATP-dependent transport was calculated by subtracting transport in presence of AMP from that in presence of ATP. Inhibition curves were fitted by using GraphPad Prism 6.01 software (San Diego, California, USA) and values are expressed as mean ± SD of percentage uptake of fourindependent experiments.

