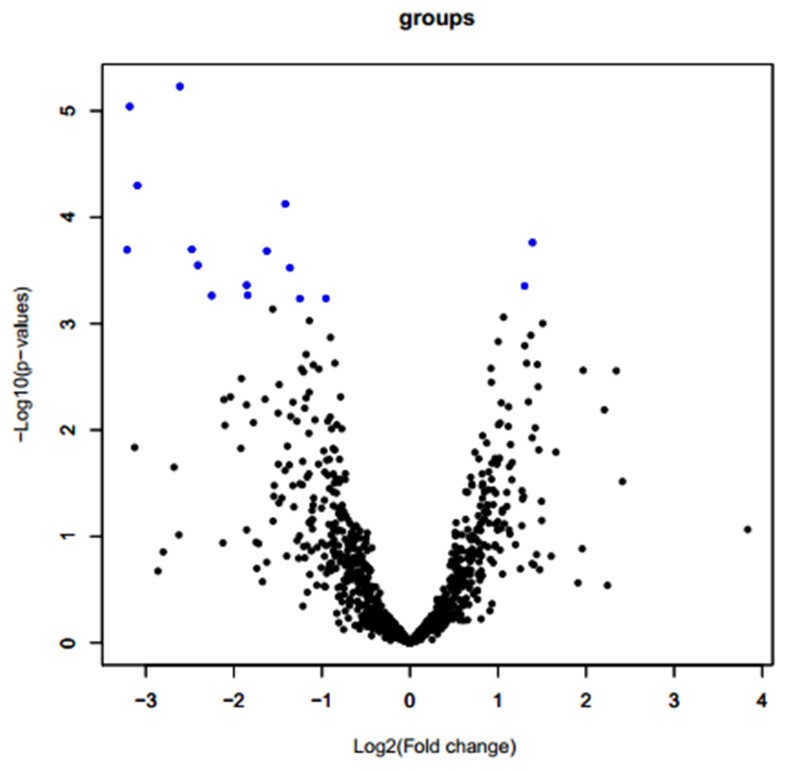
Figure 1. Volcano plots depicting estimated fold changes (log2, x-axis) and statistically significant differences (−log10, p-value, y-axis).
Each point represents a gene, and colors correspond to the ranges of the negative log10 P and log2 fold change values. Blue circles: differentially expressed genes. Fold changes >0 indicate up-regulated genes, whereas fold changes <0 indicate down-regulated genes. Black circles: no statistically significant expressed genes.

