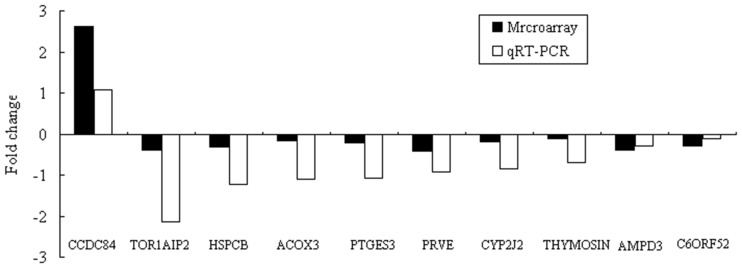
Figure 3. Validation of the 10 differentially expressed genes obtained from microarray analysis by qRT-PCR, n = 3.
The p-values of the qRT-PCR data are as follows: 0.0067 (C6ORF52), 0.3920 (CCDC84), 0.3661 (THYMOSIN), 0.8195 (PRVE), 0.3154 (HSPCB), 0.6534 (CYP2J2), 0.002 (AMPD3), 0.1622 (TOR1AIP2), 0.8329 (PTGES3), 0.8808 (ACOX3).

