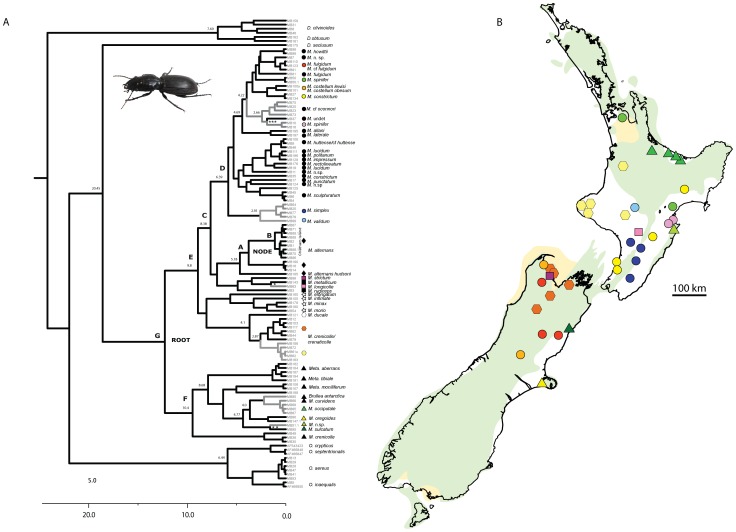
Figure 3. The timing of Mecodema diversification.
A) COI Bayesian tree generated in BEAST. Numbers on nodes show age estimates based on stratigraphic calibration of 4 Myr. Outgroup taxa were the same as used in the outgroup test (Fig. 1). Grey branches indicate lineages present in North Island New Zealand, and black branches indicate South Island lineages. Tip symbols correspond to clade and location identifiers in Fig. 2. Coloured symbols match symbols in Fig. 3B, highlighting disjunct lineages in southern North Island and northern South Island. Asterisks indicate age estimates between N.I. and S.I. lineages (* = 1.60 Myr, ** = 1.69 Myr, *** = 2.03 Myr). B) Reconstruction of the paleogeographic environment in lower North Island, New Zealand ca. 3 million years ago, green areas indicating likely land above sea level during this time (modified from [28]). Black outlines indicate present day New Zealand land area with coloured symbols corresponding to those in Fig. 3A, showing the present sampling locations of some sister taxa in North Island and South Island. (Scale bar = 100 km.)

