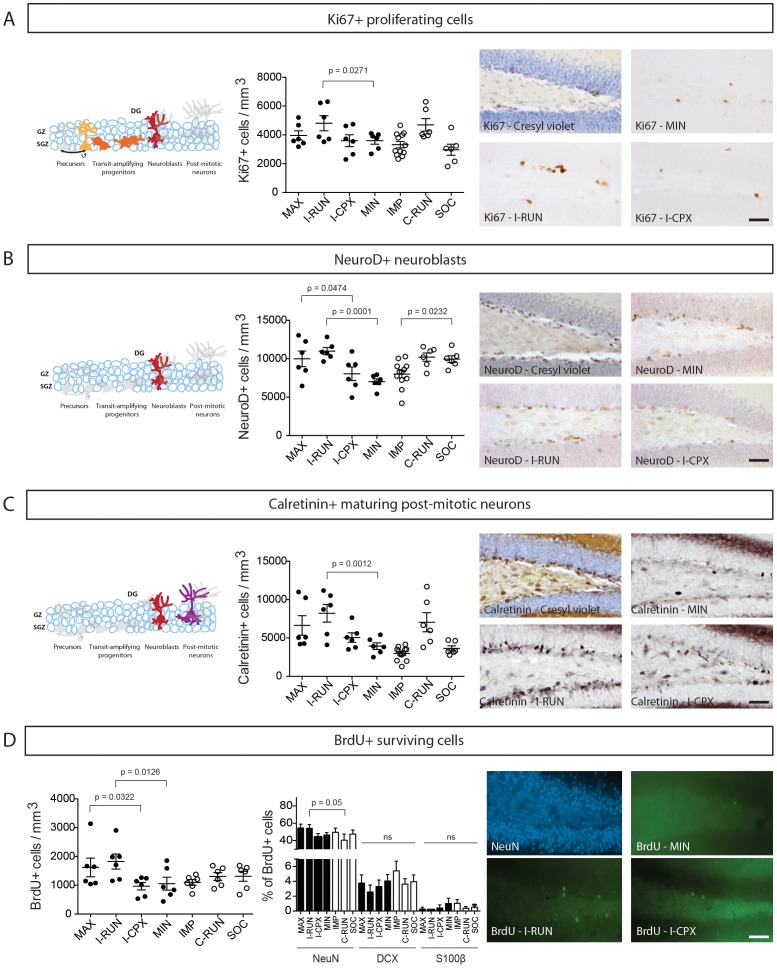
Figure 2. Effects of Alternating EE on the main stages of dentate gyrus neurogenesis.
A–D, Quantification of the density of A, Ki67+ proliferating cells, B, NeuroD+ neuroblasts, C, Calretinin+ maturing post-mitotic neurons, and D, BrdU+ surviving cells. At the right of each panel is a sample cresyl-violet counterstaining (A–C) or NeuN-labeling (D) (upper left image), and representative non-counterstained sections from MIN (upper right), I-RUN (lower left) and I-CPX (lower right) experimental groups. Note that a main significant effect of the Running disc environment (I-RUN) was detected for all four neurogenesis markers, while the Complex environment (I-CPX) did not have a main effect on any marker and did not potentiate the effects of running. In D, middle panel, quantification of the percentage of BrdU+ cells that co-express NeuN, DCX or S100β. See Results for further details. Scale bar = 50 µm. DG = Dentate Gyri.

