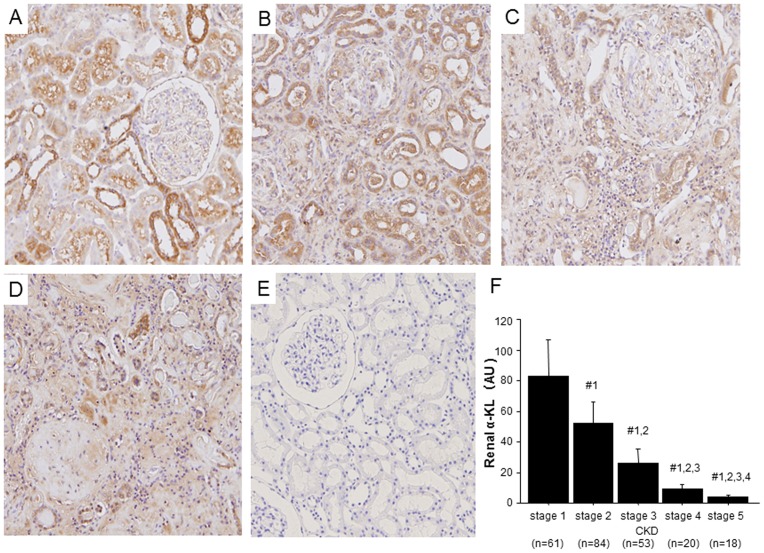
Figure 1. Reduction of renal α-Klotho (α-KL) expression with progression of CKD.
(A–D) Representative images showing immunoperoxidase staining of α-KL in renal biopsy sections from CKD patients at (A) stage 1, (B) stage 3, (C) stage 5 and (D) stage 5 HD. (E) Negative control (stage 1 CKD patient treated with rat immunoglobulin instead of rat anti-α-KL antibody). Original magnification, 100×. (F) Renal α-KL mRNA levels. Tukey's Honestly Significant Difference (HSD) post hoc test with Bonferroni's adjustment was used to compare groups: #1, P<0.005 vs. stage 1; #2, P<0.005 vs. stage 2; #3, P<0.005 vs. stage 3; #4, P<0.005 vs. stage 4.

