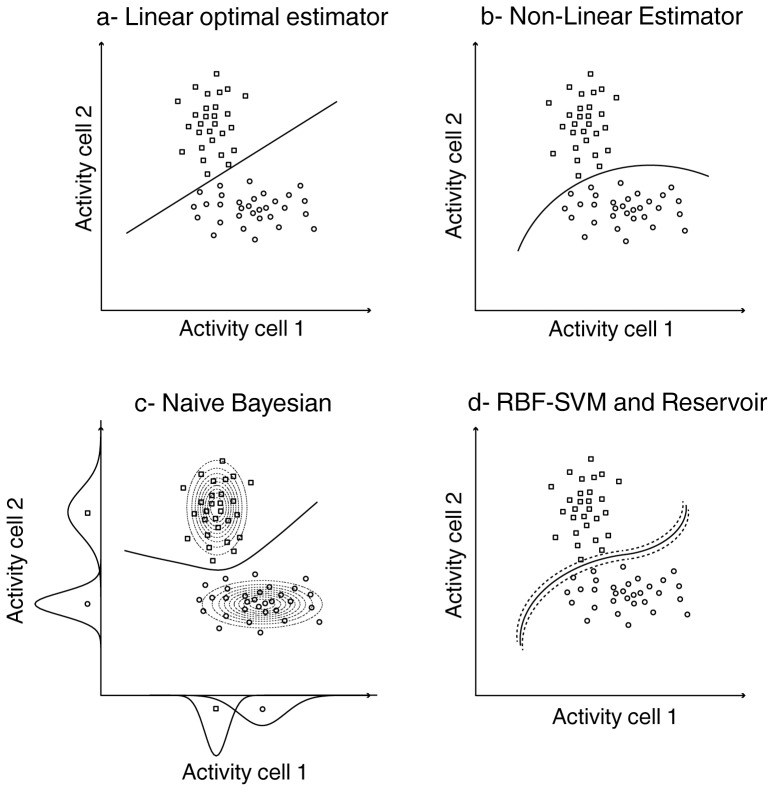
Figure 3. Decision boundaries for the different classifiers.
Each plot represents the activity of a hypothetical cell 1 as a function of the activity of hypothetical cell 2, on successive trials, in response to a stimulus 1 (circles) or 2 (squares). a) Optimal linear estimator; b) non-linear estimator; c) naive Bayesian. The dotted ellipsoids (Bayesian) correspond to the probability-density fitted Gaussian distributions of the cells' activities for each stimulus; d) SVM with Gaussian kernel (RBF) and Reservoir. In the case of SVM, the dotted line corresponds to the margin around the decision boundary.

