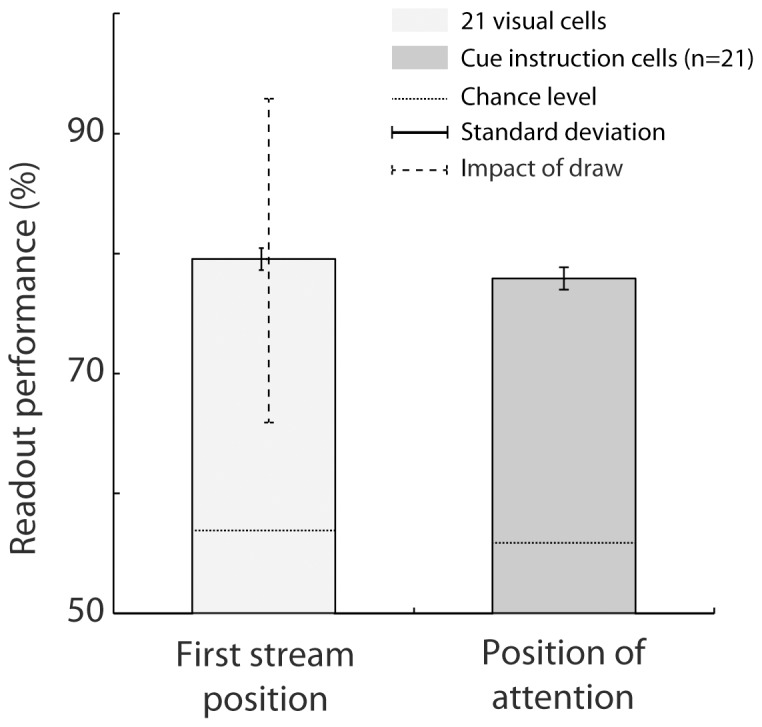
Figure 5. Comparison of decoding flow onset (light gray) with 21 visual cells versus decoding spatial position of attention (dark gray) with the 21 cells with significant individual attention-related responses.

The mean read-out performance across 20 runs is showed with standard deviation around this mean. The dotted line corresponds the maximum- and minimum performance across 20 draws of 21 visual cells out of 111. The SVM classifier was used. The mean readout performance and the associated standard error around this mean are calculated over 20 decoding runs. Chance level is defined using a random permutation procedure (p<0.05).
