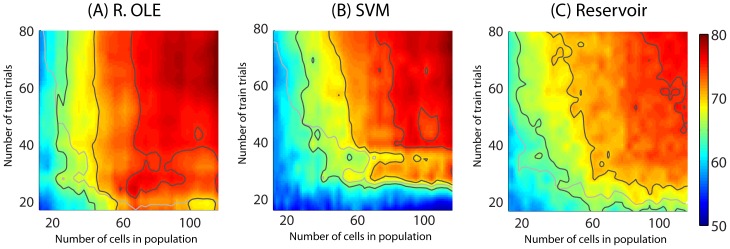
Figure 6. Decoding of spatial attention from the whole FEF population activities as a combined function of number of trials and cells with (A) Regularized OLE, (B) SVM and (C) Reservoir decoders.

The black contour lines correspond, from yellow to dark red regions, to 65, 70 and 75% of readout performance. The gray contour lines corresponds to chance level as calculated, at each point, by a random permutation test (p<0.05). Smoothing with Gaussian kernel of 7. The readout performance is an average readout performance on 10 decoding runs. The maximum possible number of training trials is 84 trials. The y-axes are truncated at 80 trials.
