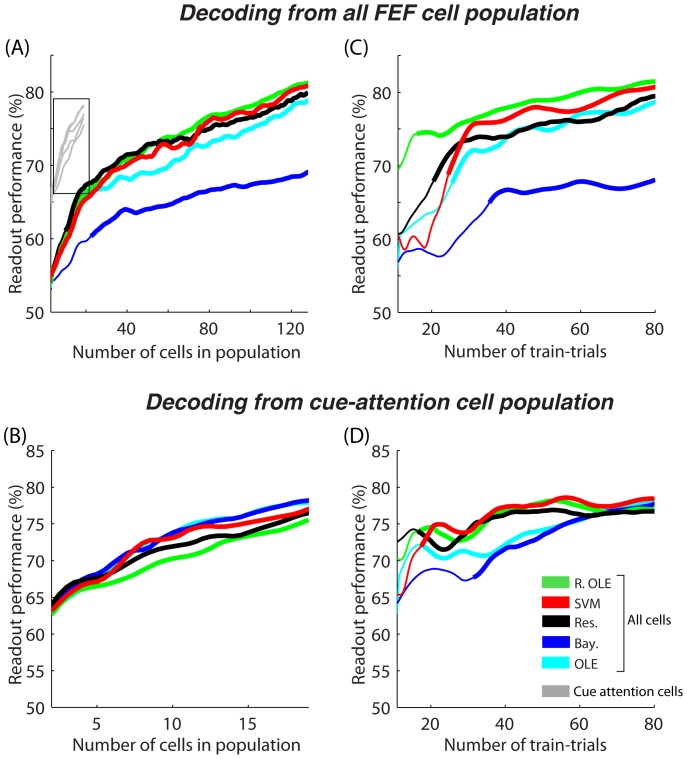
Figure 7. Decoding spatial attention (A–B) as a function of cell population size and (C–D) number of trials available for training.
In (A) and (C), decoding is performed on the whole FEF cell population while in (B) and (D), decoding is performed only on the attention-related cells -presented also in gray in (A). The mean readout performance is calculated over 20 decoding runs. Thick lines indicated values that are significantly above chance as calculated using a random permutation test (p<0.05). SVM = support vector machine, Res = reservoir, Ex. OLE = explicit OLE, Bay. = Bayesian, NLE = ANN non-linear estimator, OLE = ANN optimal linear estimator.

