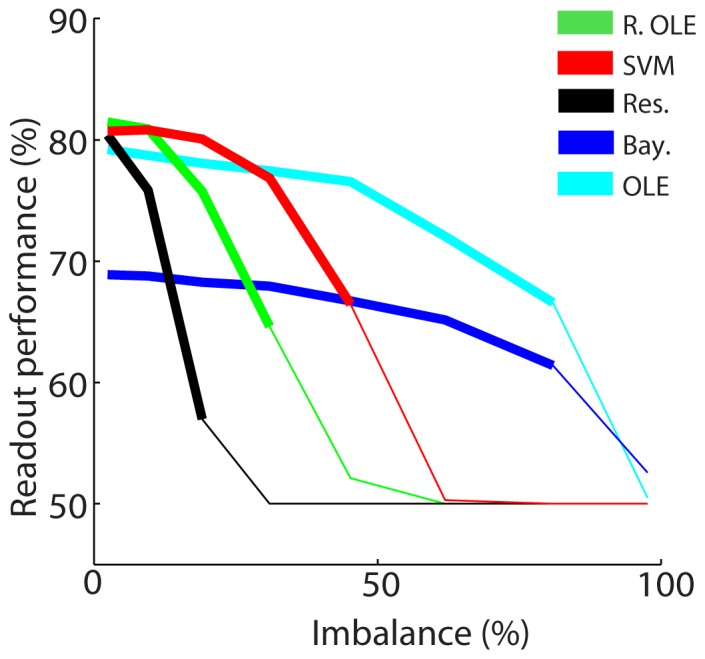
Figure 8. Impact of imbalance in the training set.

The y-axis represents the difference between the readout performance of a balanced data set (same number of trials for each condition) and that of an unbalanced data set (more trials in condition 1 than in condition 2). The x-axis represents the degree of imbalance in training trial number between the two conditions. The mean readout performance and the associated standard error around this mean are calculated on 20 decoding runs. Thick lines indicated values that are significantly above chance as calculated using a random permutation test (p<0.05). SVM = support vector machine, Res = reservoir, R. OLE = regularized OLE, Bay. = Bayesian, NLE = ANN non-linear estimator, OLE = ANN optimal linear estimator.
