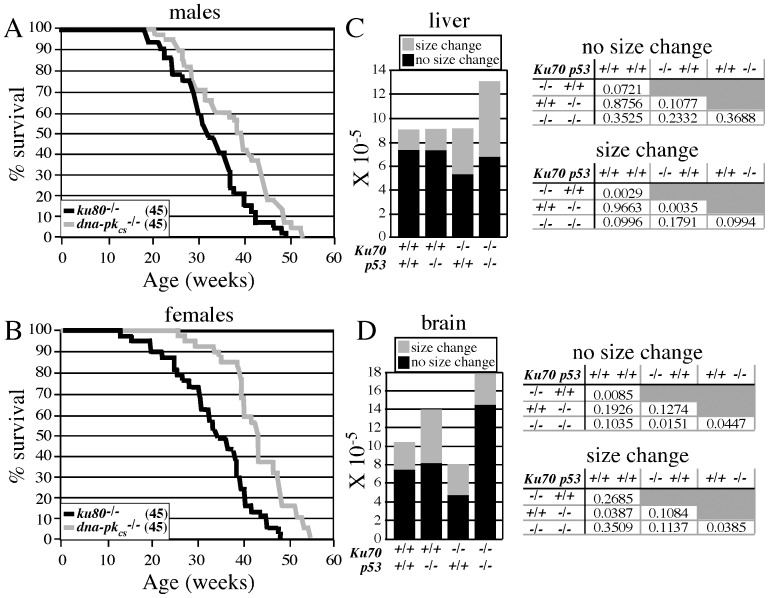
Figure 1. In vivo analysis. Life span for ku80-/- and dna-pkcs-/- (A) males and (B) females (45 mice in each cohort).
Mutation spectrum in ku70-/- mice with and without p53 in the (C) liver and (D) brain. Size changes are chromosomal rearrangements that include translocations and large insertions/deletions. No size changes are point mutations (base changes and small insertions/deletions). A student t test was performed for a statistical analysis and tables are presented showing all possible comparisons.

