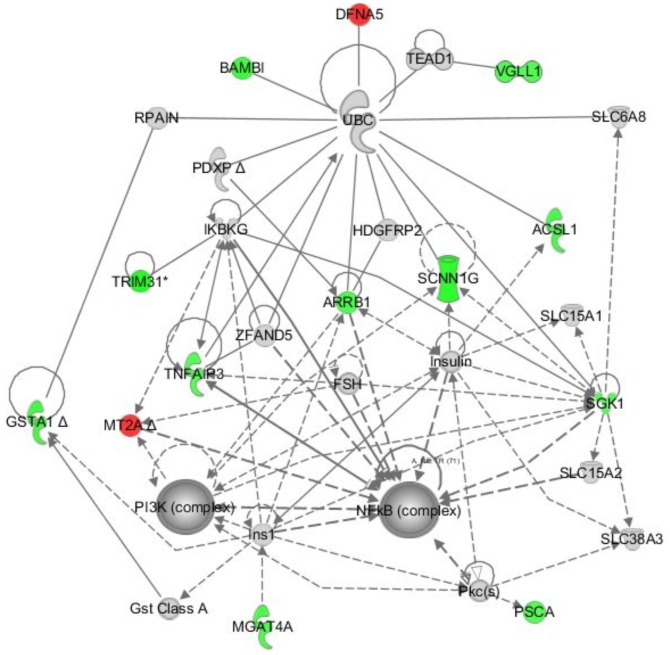
Figure 3. Genes dependent on FGFR3 and TAK1 signaling map to signaling networks with a major hub around NFκB.
The 13 unique FGFR3 and TAK1 dependent genes (Table 1) were evaluated by Ingenuity Pathway Analysis (IPA) software, producing a single network (network score of 40) containing major hubs at NFκB and PI3K. IPA molecular shapes include: complex/group (NFκB, PI3K), cytokine/growth factor (IKBKG, SGK1), enzyme (ACSL1, GSTA1, MGAT4A, PDXP, TNFAIP3, UBC), ion channel (SCNNIG), transcriptional regulator (TEAD1, VGLL1), transporter (SLC6A8, SLC15A1, SLC15A2, SLC38A3), and other (ARRB1, BAMBI, DFNA5, FSH, GST Class A, HDGFRP2, Ins1, Insulin, MT2A, PKC(s), PSCA, RPAIN, TRIM31, ZFAND5). IPA Relationships: solid lines indicate direct interaction; dashed lines indicate indirect interaction; filled arrows indicate “acts on”; open arrows indicate “translocates to”; –| indicates “inhibits” and –|▸ indicates “acts on and inhibits. Green/red indicates genes down/up-regulated in the microarray (Table 1).

