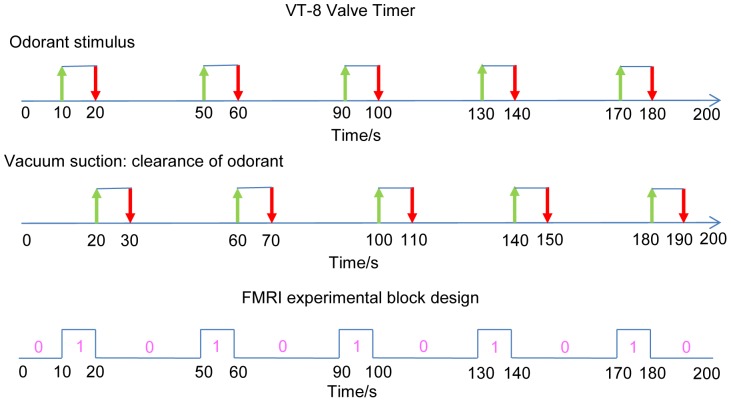
Figure 5. Odorant applicator sequences controlled by VT-8 Warner Timer software and fMRI experimental block design.
For the first sequence, green arrows indicate the onset time of the odorant stimulus and red arrows indicate when the stimulation ends. For the second one, green arrows indicate the onset of clearance of odorant, and red arrows indicate when it ends. The third sequence shows the fMRI block design in this work, matching the first sequence. “0” and “1” denote the odor “on” and “off” conditions.

