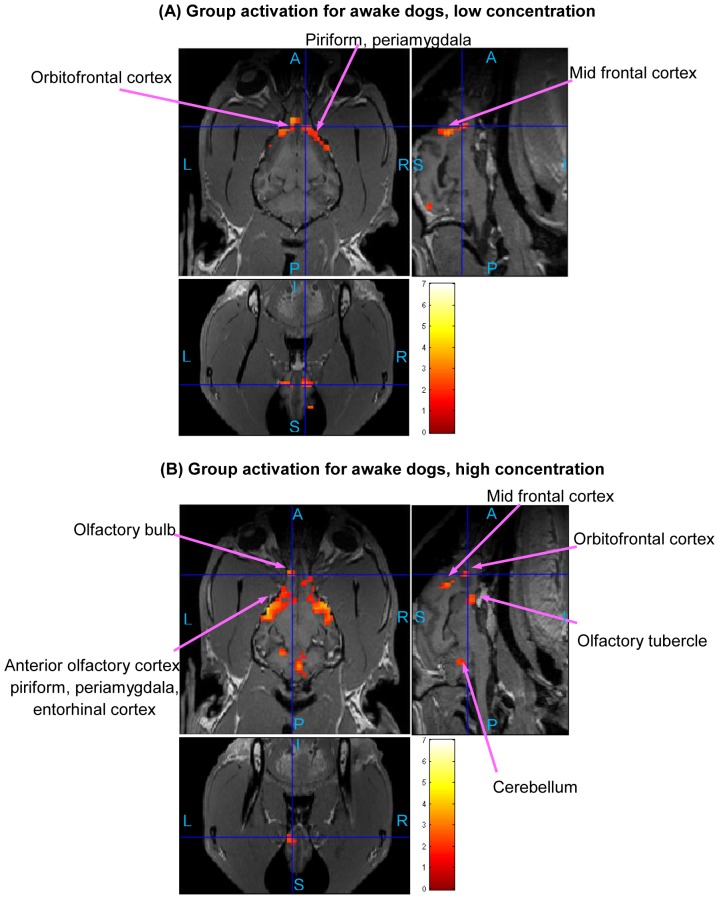
Figure 10. Group activation maps for awake dogs.
(Overall FDR = 0.05, cluster threshold = 15 voxels using AlphaSim, t-contrast) Three orthogonal views are shown for each subfigure. Hot colormap is used for activation intensity, and important areas are indicated by arrows with labels. Subfigure (A) corresponds to low concentration odorant (0.016 mM), subfigure (B) corresponds to high concentration odorant (0.16 mM). The activation in olfactory bulb for low concentration is not visible in this view, please refer to Table 3 for activation statistics with regard to this region. (A: Anterior, P: posterior, S: superior, I: inferior, L: left, R: right)

