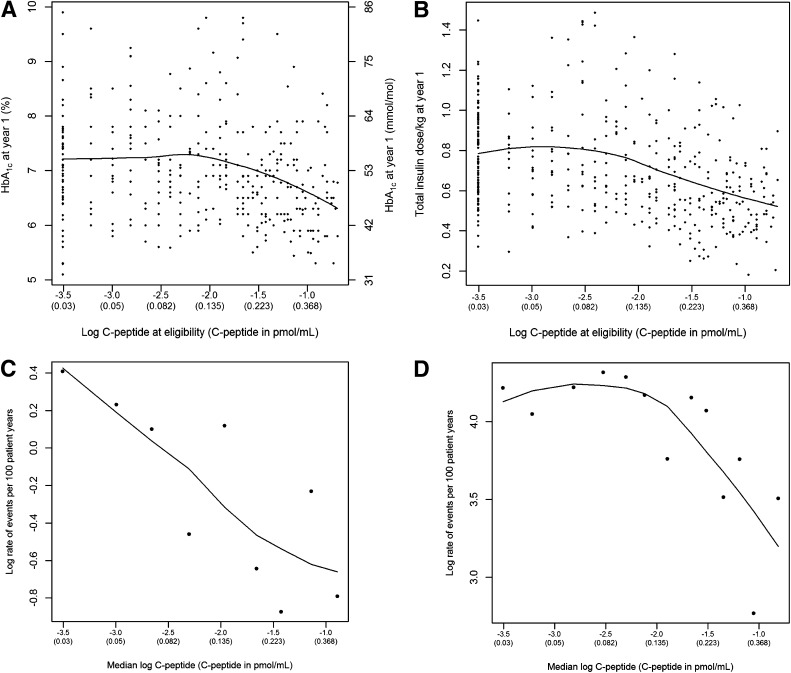
Figure 1.
Model-free LOESS estimates of the association of the log of the stimulated C-peptide on study entry with (A) the HbA1c value at year 1 of follow-up, (B) the total insulin dose at year 1, (C) the incidence of retinopathy progression, and (D) the incidence of hypoglycemia. For C and D, the log of the rate per 100 patient-years of the event is plotted within percentiles of the C-peptide distribution.

