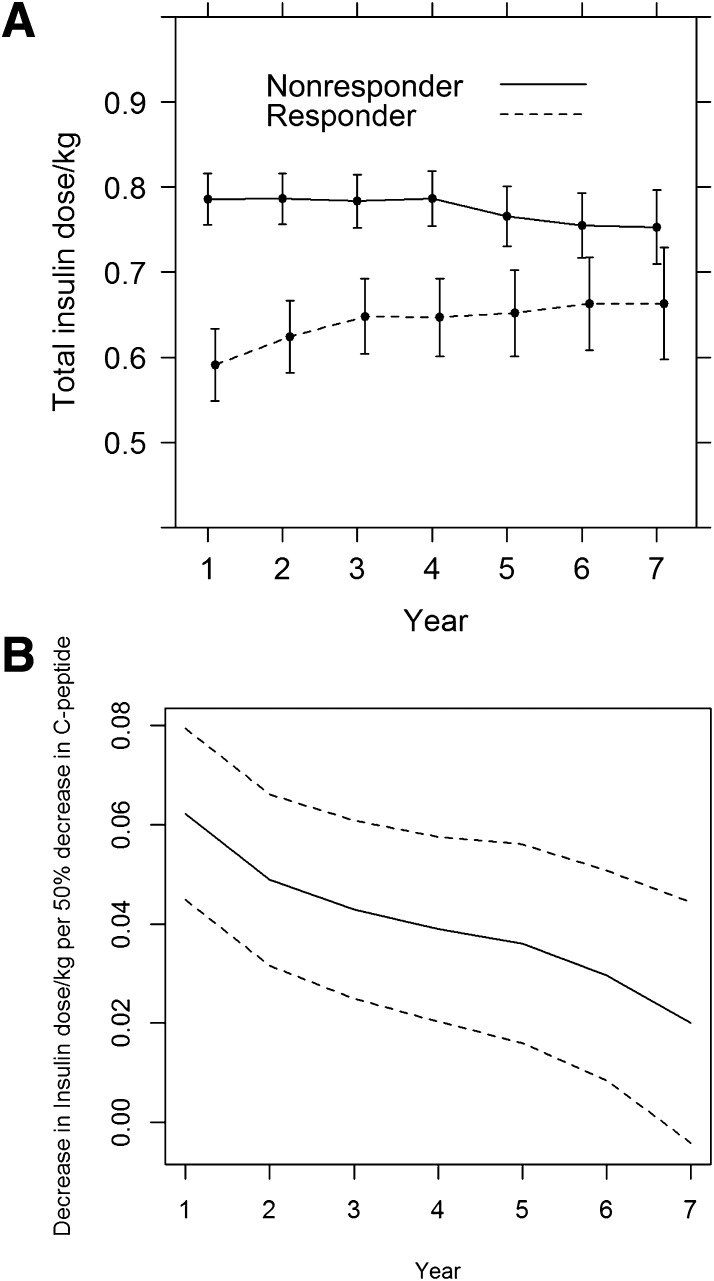
Figure 3.
Association of stimulated C-peptide at study entry, qualitatively and quantitatively, with the total insulin dose (units per kilogram per day) at each successive year of follow-up, from longitudinal regression models. A: Mean insulin dose among responder vs. nonresponder. B: Change in insulin dose units per kilogram per day per 50% lower stimulated C-peptide, each with 95% confidence limits.

