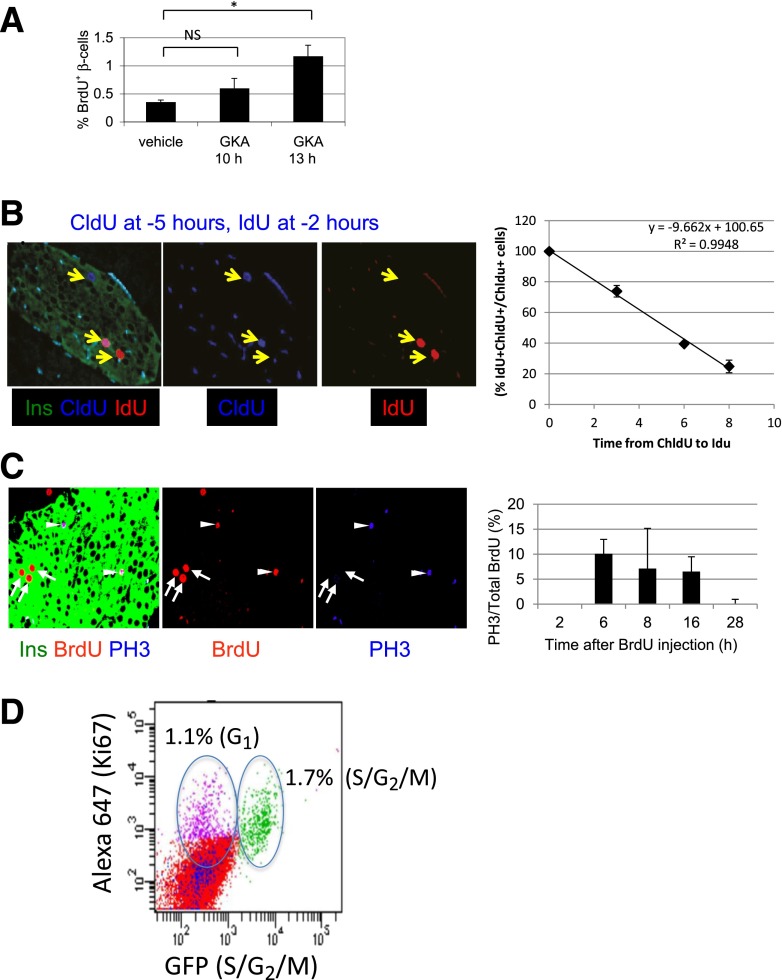
Figure 2.
Defining the duration of G1, S, and G2/M in β-cells in vivo. A: GKA increases BrdU incorporation in β-cells 13 h after administration. B: Double labeling with thymidine analogs to estimate duration of S phase. Left panels: Representative image from a mouse killed 2 h after IdU injection. CldU was injected 3 h prior to IdU. Arrows point to a CldU+ β-cell (left), CldU+ IdU+ double positive β-cell (middle), and IdU+ β-cell (right). Right panel: Graph depicting the percent of CldU+ β-cells that costain for IdU, when IdU is injected at different times after CldU. C: BrdU-PH3 staining to estimate duration of G2 phase. Left panels: Representative immunofluorescence image. BrdU was injected 6 h prior to sacrifice. Arrowheads point to BrdU+ PH3+ mitotic β-cells. Arrows point to BrdU+ PH3− β-cells. Right panel: Percent of BrdU+ β-cells that stain for PH3, at different time points after injection of BrdU, reflecting the duration of G2 as described in text. D: FACS analysis of dissociated islet cells from 3-week-old CyclinB1-GFP mice (n = 4 mice, pooled), costained for GFP and Ki67. A total of 2.8% of islet cells are Ki67+, 1.7% of islet cells costain for Ki67 and GFP, marking cells in S-G2 phases of the cell cycle, and 1.1% are Ki67+GFP−, representing G1 cells. *P < 0.05. NS, not significant.

