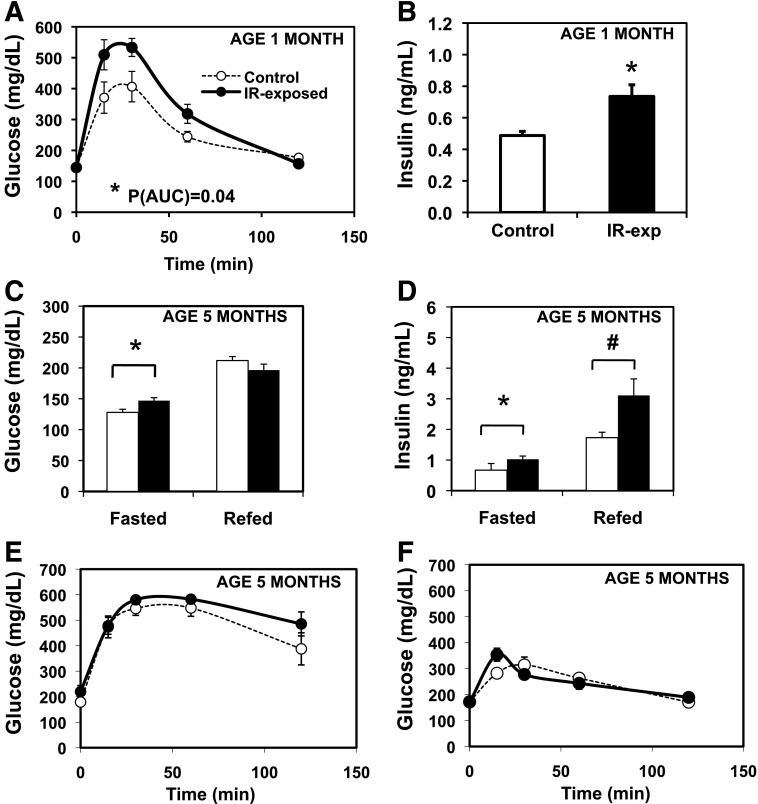
Figure 3.
Altered glucose homeostasis in male offspring of insulin-resistant mothers. A: IP-GTT (2 g/kg) in males, chow fed, aged 1 month. n = 6–8 pups, representing three litters per group. *P(AUC) = 0.04; *P(rmANOVA) = 0.05. B: Insulin, fasted, males, aged 1 month. n = 6–8 pups, representing three litters per group. *P = 0.02. C: Glucose in the fasted (16 h) and refed (4 h) state. Chow-fed males, aged 5 months. n = 8–9 per group, representing three litters per group. *P = 0.02. D: Insulin, fasted for 16 h and refed (4 h). Chow-fed males, aged 5 months. n = 8–9 per group, representing three litters per group. *P = 0.02; #P = 0.05. E: IP-GTT (2 g/kg) in males, chow-fed, aged 5.5 months. n = 8–9 per group, representing three litters per group. P(AUC) = 0.09; P(rmANOVA) = 0.08. F: Glycemic excursion after 2 g/kg oral glucose gavage. n = 5–8 pups, representing three litters per group, chow-fed males, aged 5.5 months. Filled circles denote IR-exposed offspring, and open circles with dashed line denote controls. P(AUC) = 0.96; P(rmANOVA) = 0.72.

