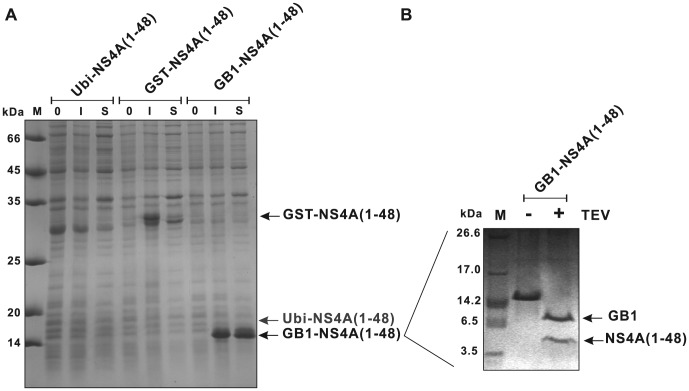
Figure 2. Comparative expression of NS4A(1–48) constructs containing single fusion tags.
(A) SDS-PAGE analysis of the relative expression levels of NS4A fusions with ubiquitin (Ubi-NS4A(1–48)), glutathion-S-transferase (GST-NS4A(1–48)) and immunoglobulin-binding domain of streptococcal protein G (GB1-NS4A(1–48)). Aliquots of the expression cultures taken before (0) or 3 hours after IPTG induction (I) were applied. Aliquots of the supernatants after cell lysis (S) are shown as well. (B) TEV cleavage of the purified GB1-NS4A(1–48) fusion protein. Purified GB1-NS4A(1–48) fusion protein after size exclusion chromatography before (−) and after (+) TEV digestion together with a molecular weight marker (M; M3546, Sigma) were applied.

