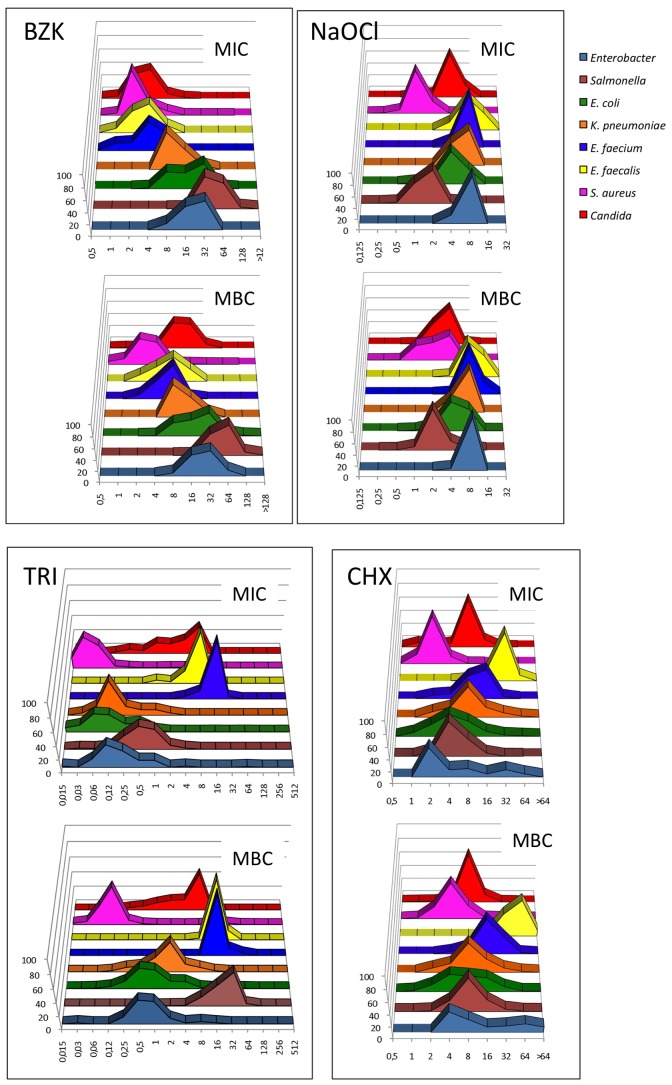
Figure 1. Populational susceptibility to biocides of different pathogens:
To analyze the overall susceptibility to the studied biocides, the MICs and MBCs (MFCs in the case of Candida) of several independent isolates were established. The name of the studied biocide is displayed in each panel. In all cases the upper graph shows the MICs distributions and the lower one the MBCs distributions. TRI, CHX and BZC, concentration as expressed in mg/L. For Nalco concentration is expressed as g/L of active chlorine.

