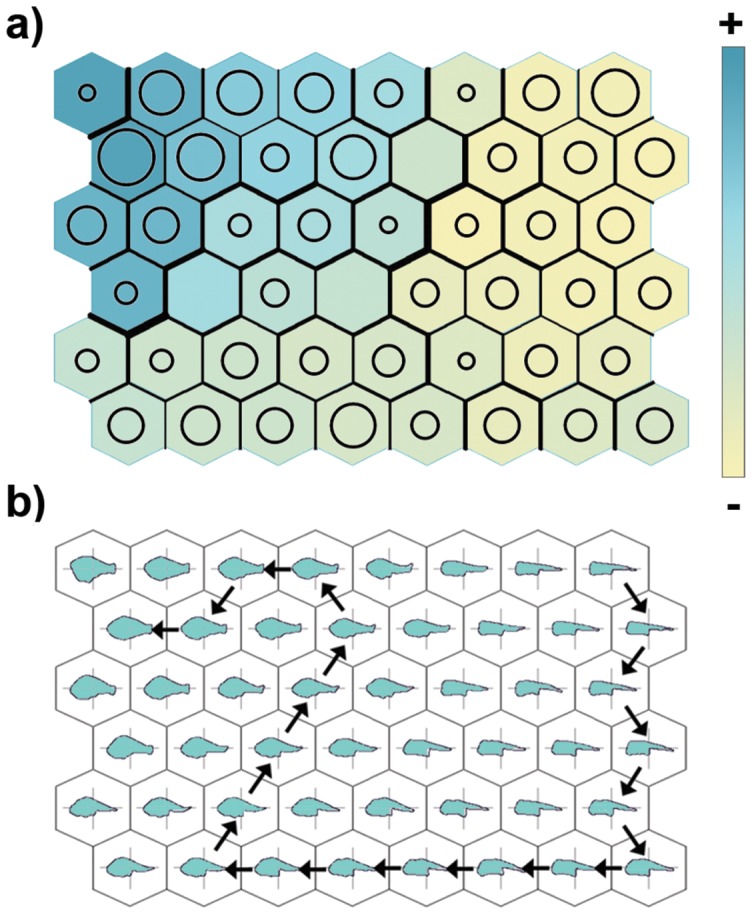
Figure 3. Trained SOM for dusky grouper in which (a) the size (TL) of specimens is visualized by colour scale, while the number of specimens assigned to each map unit is represented by a bubble, and the distance between neighbouring units is represented by differential thickness of the hexagon borders; and (b) a sample path in the shape development is represented by arrows connecting virtual shape prototypes.

