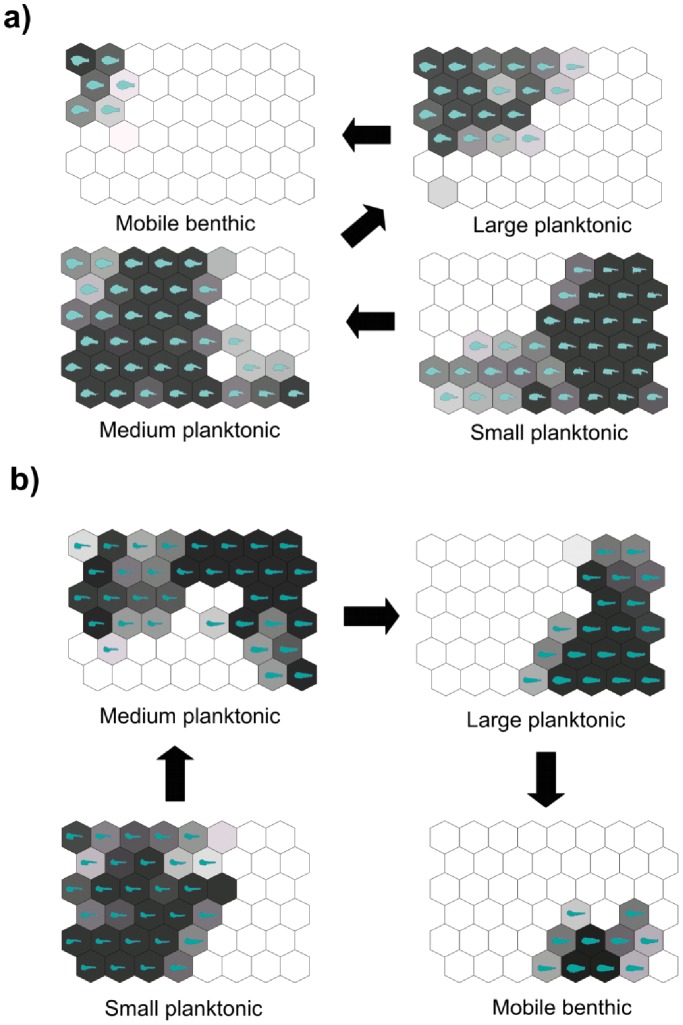
Figure 5. Visualization of the food vectors on the trained SOM maps.
The mean value of each vector was calculated in each output neuron of the trained SOMs. Dark grey represents high values while light grey indicated low values. (a) Dusky grouper; (b) Gilthead sea bream. The virtual shape prototypes are also reported for comparative purposes.

