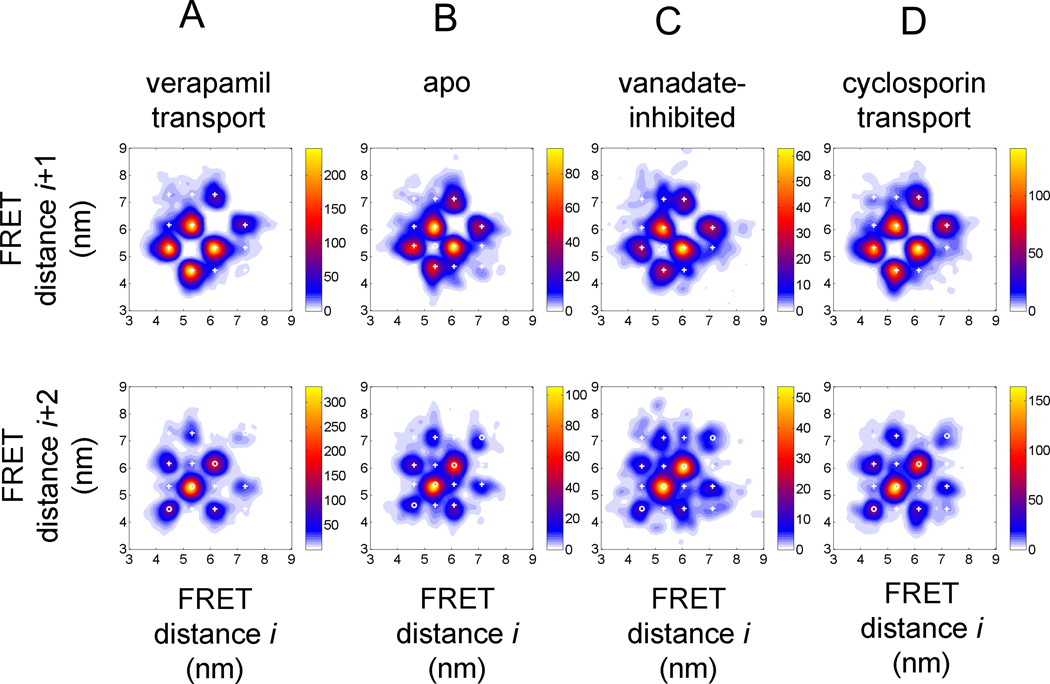
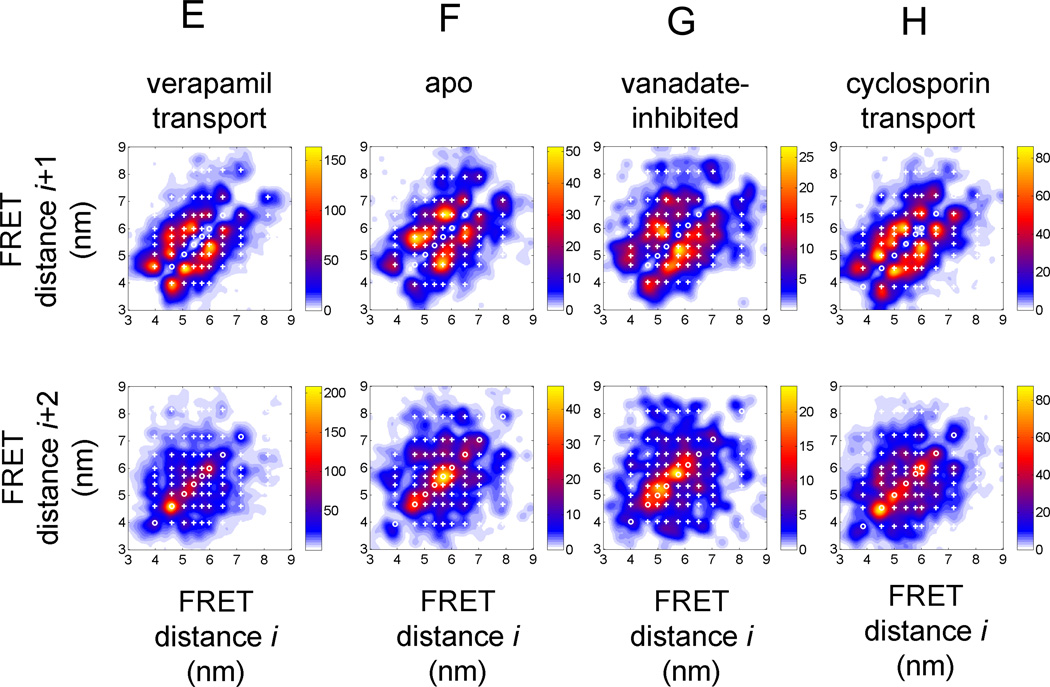
Figure 4.
FRET transition density plots for HMM assigned FRET states in Pgp. (A–D) 4-state HMM results for the four biochemical conditions (A) 'verapamil transport', (B) 'apo', (C) 'vanadate-inhibited', (D) 'cyclosporin transport'. Upper row, FRET transitions between sequential FRET states Si and Si+1; lower row, FRET transitions between next but one FRET states Si and Si+2. (E–H) 9-state HMM results for the four biochemical conditions (E) 'verapamil transport', (F) 'apo', (G) 'vanadate-inhibited', (H) 'cyclosporin transport'. Upper row, FRET transitions between sequential FRET states Si and Si+1; lower row, FRET transitions between next but one FRET states Si and Si+2. Color map coding indicates minimal and maximal occurrences of FRET transitions for each plot.


