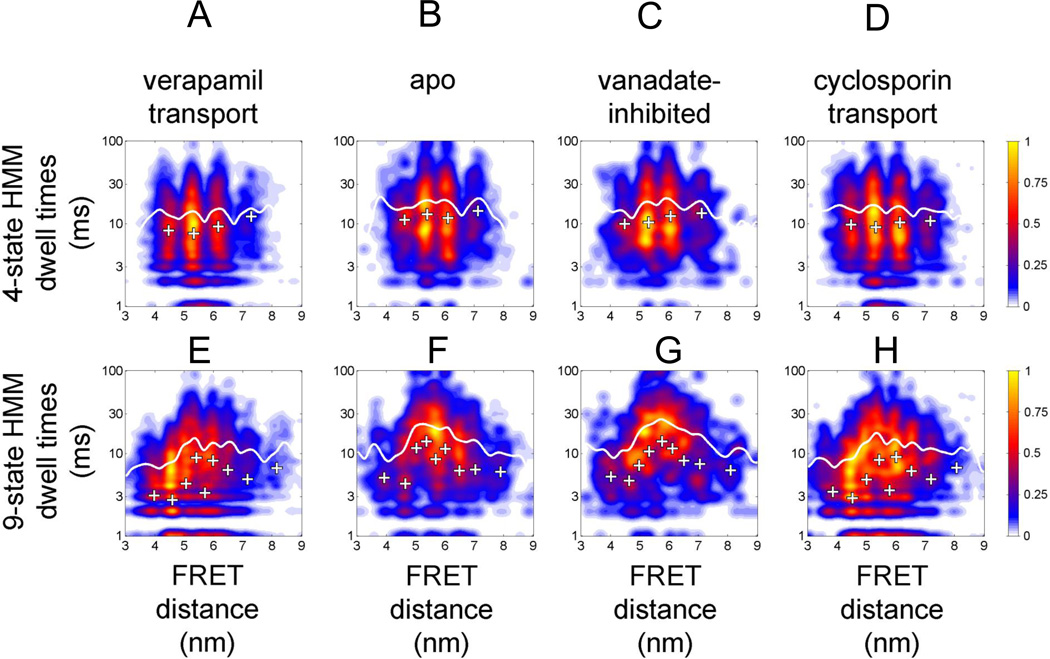
Figure 5.
Dwell time distributions for assigned FRET states related to FRET distance. (A–D) 4-state HMM results for the four biochemical conditions (A) 'verapamil transport', (B) 'apo', (C) 'vanadate-inhibited', (D) 'cyclosporin transport'. (E–H) 9-state HMM results for the four biochemical conditions (E) 'verapamil transport', (F) 'apo', (G) 'vanadate-inhibited', (H) 'cyclosporin transport'. Note that the y axes (dwell times in ms) are plotted on a logarithmic scale. Color map coding indicates normalized occurrences for FRET transitions.

