
Figure 2.

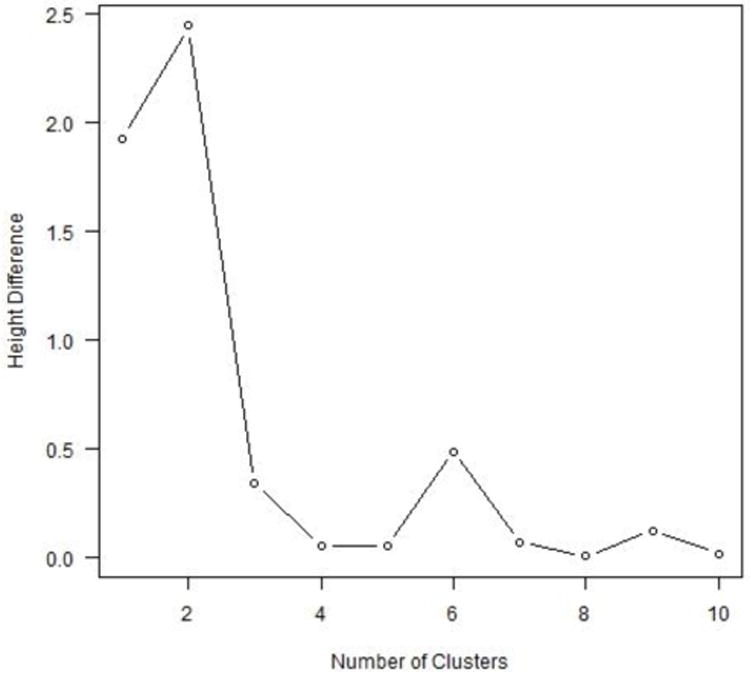
(a) Dendrogram reflecting the cluster tree based on three performance measures: proportion of time spent attending to the scene (%Scene), Eyes (%Eyes) and Eye-to-Mouth ratio. (b) Height differences in the cluster dendogram for each additional cluster added. The largest difference is made when moving from two to three clusters.