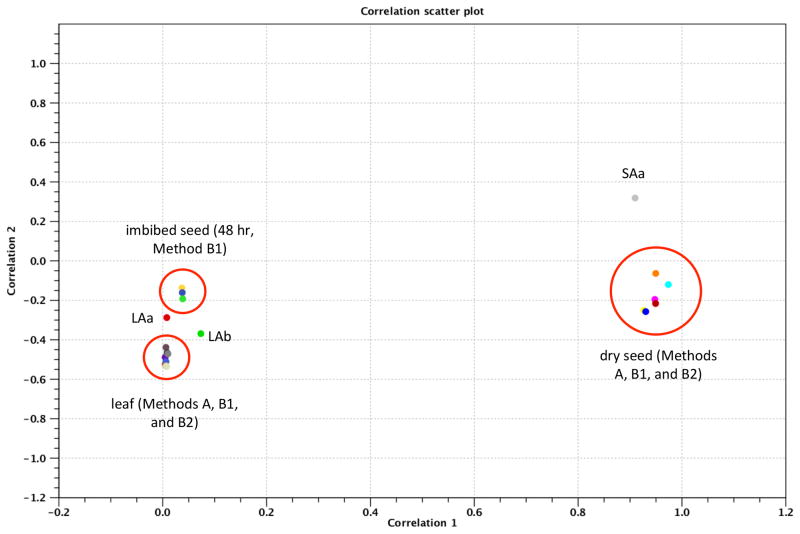
Figure 4.
Principal component analysis of the 21 PAT samples described in this report. Expression levels were determined using the RNA-seq tool in CLC Genomics Workbench; in all cases, expression values were normalized such that values had the unit of tags per million. PCA analysis was performed and plotted as shown; in this case, the two principal components account for more than 90% of all of the variability amongst the different samples in this study.

