
Figure 6.
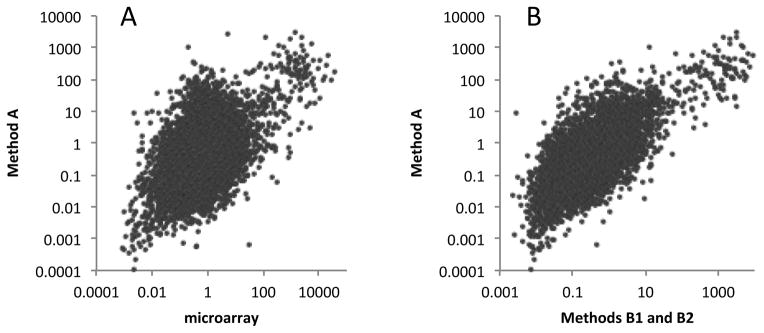
Comparison of seed/leaf gene expression ratios obtained using PATs and microarrays. A. Plot of values (displayed using a log10 scale) obtained using 8 microarray datasets (five seed and three leaf) and 5 PAT datasets (2 seed and 3 leaf); the PAT datasets were generated from tags prepared using Method A. The Pearson correlation coefficient for the linear relationship of the log-log plot was 0.47. B. Plot of values (displayed using a log10 scale) obtained using PATs prepared using either Method A or Methods B1 and B2. The Pearson correlation coefficient for the linear relationship of the log-log plot was 0.69. For these plots, 8799 genes were analyzed (this was the number that had average expression values greater than 10 tpm in either the leaf or seed samples).