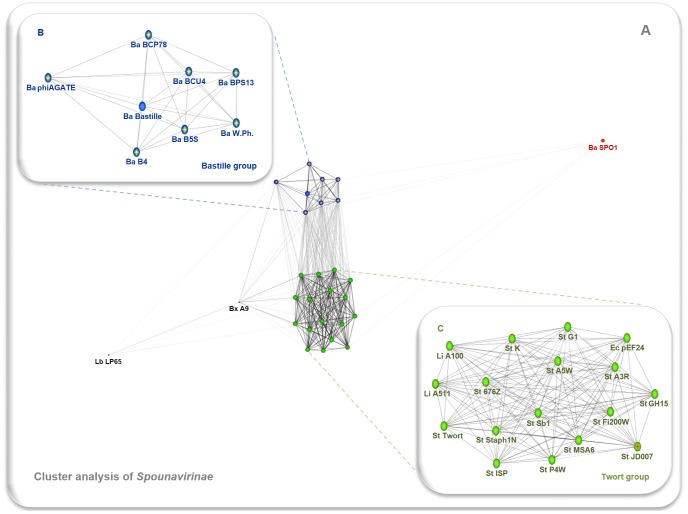
Figure 4. Results of clustering of Spounavirinae phages based on genomic similarity.
Panel A shows result of cluster analysis of the whole group of studied phages. Panel B is a close-up showing layout of the Bastille group and panel C is a similar close-up depicting the Twort group. Edge weights were calculated from the P values of BLASTn high-scoring segment pairs (e-value cut-off equals 1e-5), and the resulting network was visualized in the CLANS software package (10000 layout rounds). Nodes are colored by the proposed in-subfamily clustering: blue – Bastille group, green – Twort group, red – Bacillus phage SPO1. Abbreviations include the name of host taxon (Ba – Bacillus, Bx – Brochothrix, En – Enterococcus, Lb – Lactobacillus, Li – Listeria, St – Staphylococcus) and the bacteriophage name. All analyzed sequences are listed in Table S2.

