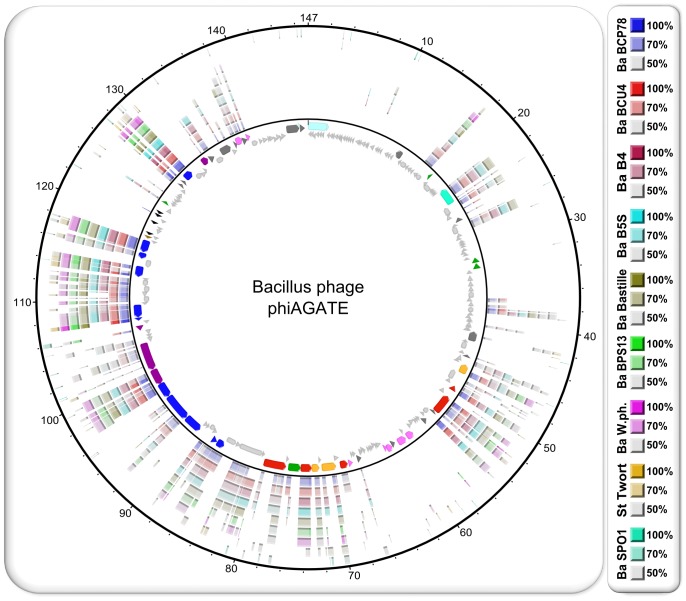
Figure 7. Genome comparison of phage phiAGATE, other members of the Bastille group, phage SPO1, and phage Twort, visualized with BRIG.
The central ring is a circular map of the reference genome, in this case genome of phiAGATE. Each further ring represents a genome of another bacteriophage. Their order (starting from center) and colors are explained at the right side. The map color scheme is the same as in Figure 3 and should not be confused with the BRIG color code included in this figure (CDSs are colored according to assigned Biological Process GO terms: blue – virion assembly, pink - nucleobase-containing small molecule metabolic processes, green – regulation of transcription, DNA-dependent, red – DNA replication, mauve - peptidoglycan metabolic processes, yellow – DNA recombination, teal – (host) cell cycle, light brown – DNA methylation, dark grey – no GO term assigned, light grey – no function predicted, and tRNA genes are marked with black arrows while tandem repeats with azure ones).

