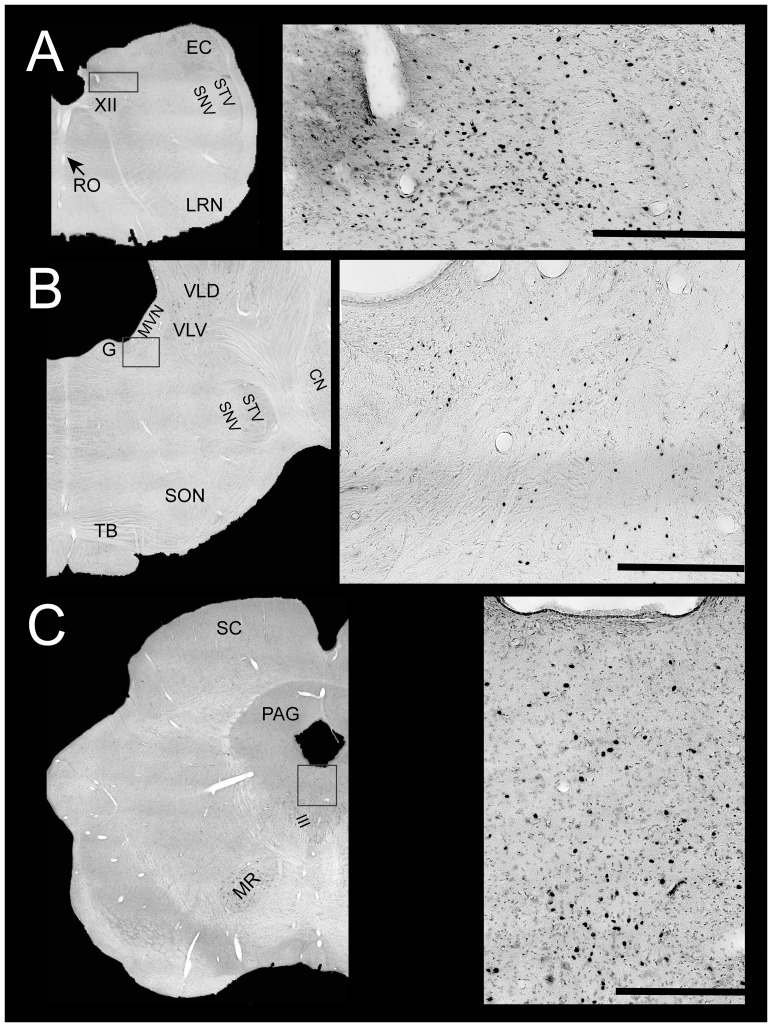
Figure 3. Photomicrographs of Fos-labeled neurons in a response type 1 animal (C52).
In each row, a rectangular box on the left diagram (generated from photomontages of sections taken using a 4X objective) shows the region depicted at higher magnification to the right. Scale bars on the right photomicrographs designate 500 µm. A, Fos labeling in nucleus tractus solitarius, approximately 13.5 mm posterior to stereotaxic zero. B, Fos labeling in the rostral portion of the medial vestibular nucleus, approximately 6 mm posterior to stereotaxic zero. C, Fos labeling in the periaqueductal gray, approximately 3 mm rostral to stereotaxic zero. Abbreviations are the same as in Figs. 1–2, with the following additions: III, oculomotor nucleus; MR, magnocellular portion of the red nucleus; PAG, periaqueductal gray; SC, superior colliculus.

