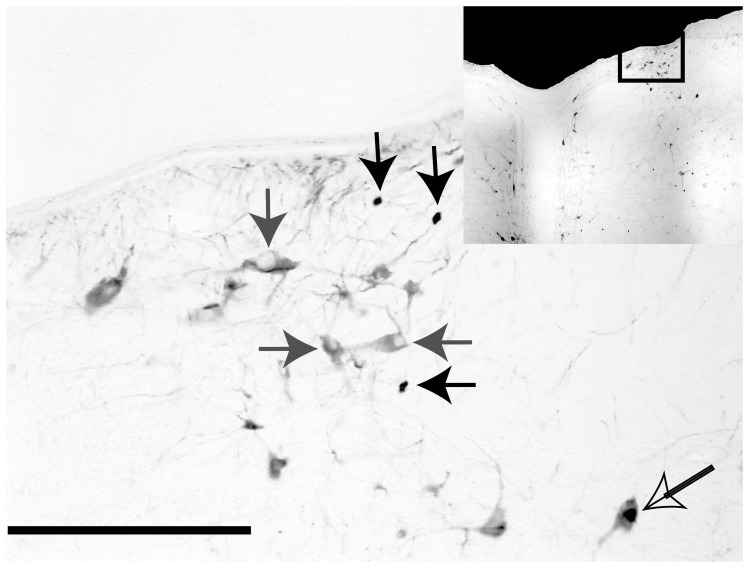
Figure 4. Photomicrograph illustrating examples of neurons that were immunopositive for Fos (solid black arrows), TPH-2 (solid gray arrows) and both TPH-2 and Fos (open arrow).
A rectangular box on the inset diagram indicates the region of the dorsal raphe nucleus depicted in the photomicrograph. The scale bar represents 250 µm.

