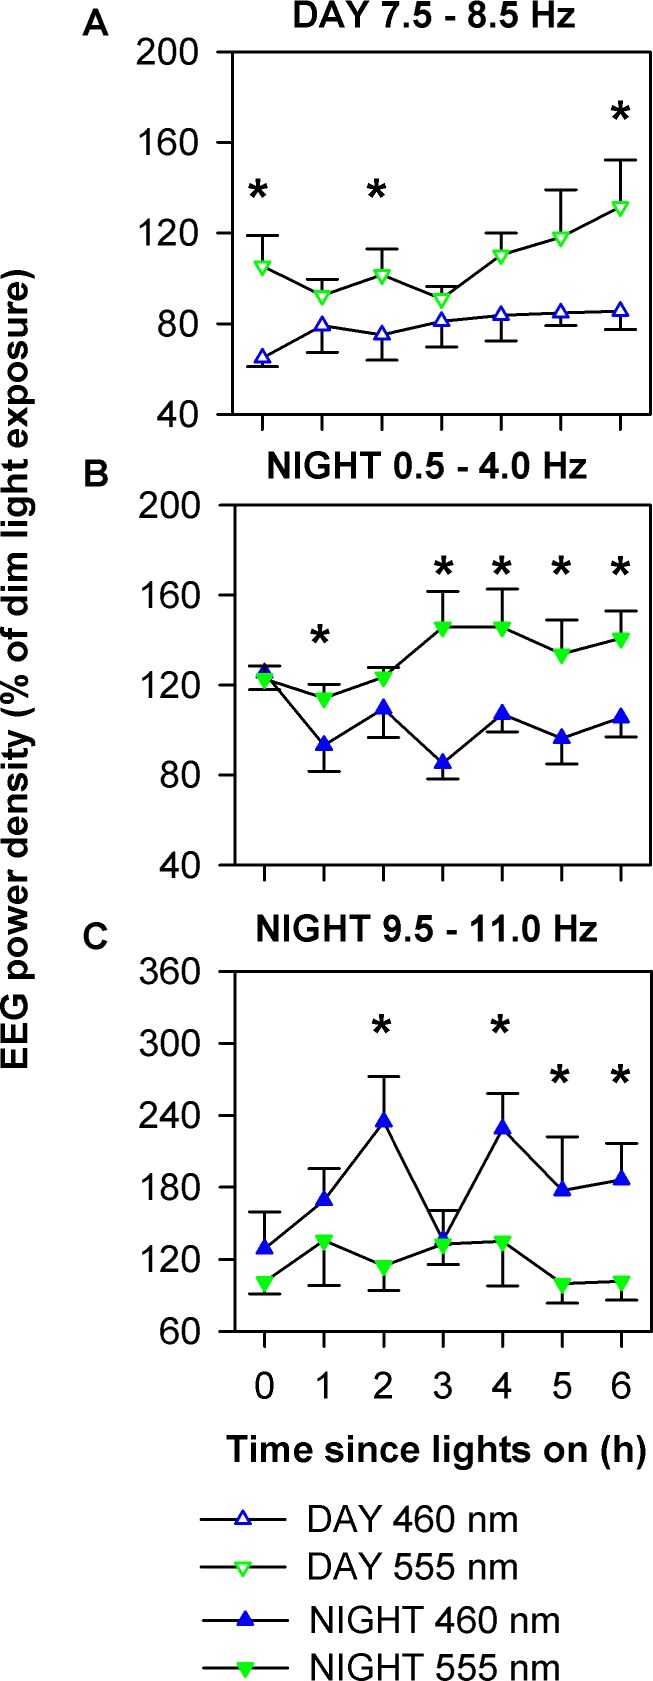
Figure 6.

Temporal dynamics in electroencephalogram (EEG) power density during daytime and nighttime monochromatic light exposure. Using the specific frequency ranges that were significantly different between 460 nm and 555 nm (Figure 5), average power density from each 3-min Karolinska Drowsiness Test session were log-transformed and expressed relative to the average of the total 6.5-h duration during the corresponding time from the constant routine on the day prior to the light exposure. Data were subjected to two-way mixed-model analysis with restricted maximum likelihood estimation method with spectral condition and exposure duration as fixed effects. Data were further subjected to Dunnett post hoc multiple comparison test when comparing between two groups. Data are shown as mean ± standard error of the mean. Significant differences in power density between conditions at specific times of the light exposure session are shown as *. During the daytime, EEG power density in the 7.5-8.5-Hz range under the 460-nm condition was consistently lower than under the 555-nm condition (A) (P < 0.05). During the nighttime, EEG power density in the 0.5-4.0 Hz range under the 460 nm condition was consistently lower than under the 555 nm condition (B) (P < 0.001) whereas EEG activity in the 9.5-11.0 Hz range changed under the 460-nm condition during light exposure but remained consistently higher than under 555 nm exposure (C) (P < 0.001).
