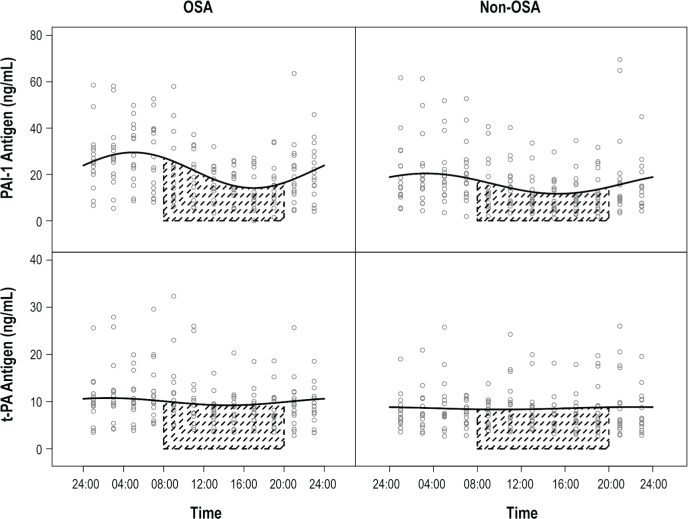
Figure 2.
Twenty-four-hour variability of PAI-1 and t-PA antigen in patients with OSA and normal controls. PAI-1 and t-PA circadian variations (oscillations) were evaluated by fitting non- linear mixed-effect models y = (M + u1) + (A + u2) sin(2π ÷ 24hr × t + B + u3), where M was the rhythm-adjusted mean, A was the amplitude, and B was the acrophase. In the above formula, the peak time (time of the day at which the maximum level of the variable was reached) was calculated by setting sin [(2*π / 24hr) * time + B] = sin [0.5 π] = 1. The solid line is based on the model and it is an estimator of population mean PAI-1 or t-PA antigen along the time. The mean amplitude of PAI-1 antigen in the OSA group was 3.3 units higher than that of the non-OSA group (P = 0.03). Shaded portion shows circadian night. OSA, obstructive sleep apnea; PAI-1, plasminogen activator inhibitor-1; t-PA, tissue-type plasminogen activator.

