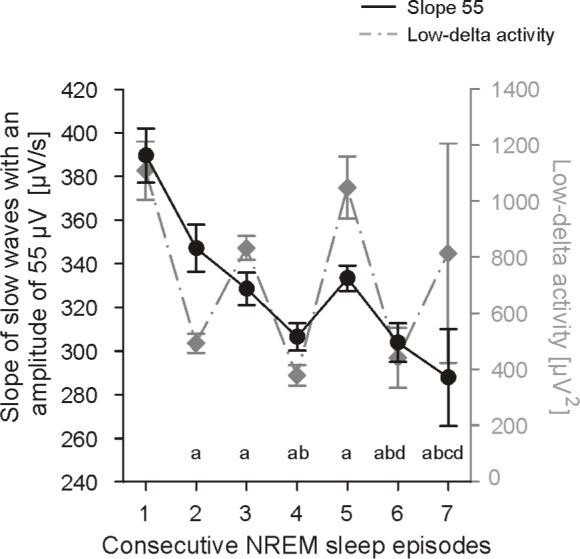
Figure 5.

Slope of slow waves with an amplitude of 55 μV (slope55) of the first 7 NREM sleep episodes at the age of 6 months for 6 infants: Group mean values ± SE. (aP < 0.006 vs. 1st NREM episode, bP < 0.008 vs. 2 nd NREM episode, cP < 0.008 vs. 3rd NREM episode, and dP < 0.05 vs. 5 th NREM episode). Low-delta activity (for details of the calculation see Jenni et al.11) is shown in gray (right ordinate) to illustrate the different time course.
