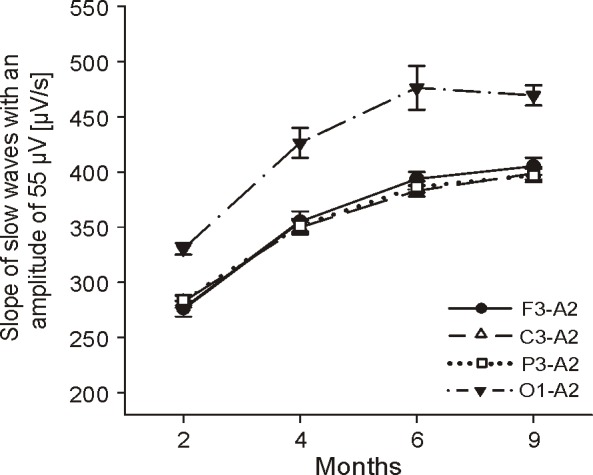
Figure 6.

Topographical differences in the slope of slow waves with an amplitude of 55 μV (slope55) of the first hour of NREM sleep: Values represent group means ± SE for the frontal, central, parietal, and occipital derivation (referenced to the right mastoid). Significant group effects were found for factor age and channel (Fage = 182.84, P < 0.001; Fchan = 69.68, P < 0.001); 2 mo: n = 10 (except for channel F3-A2 n = 9), 4 mo: n = 10, 6 mo: n = 9, 9 mo: n = 7.
