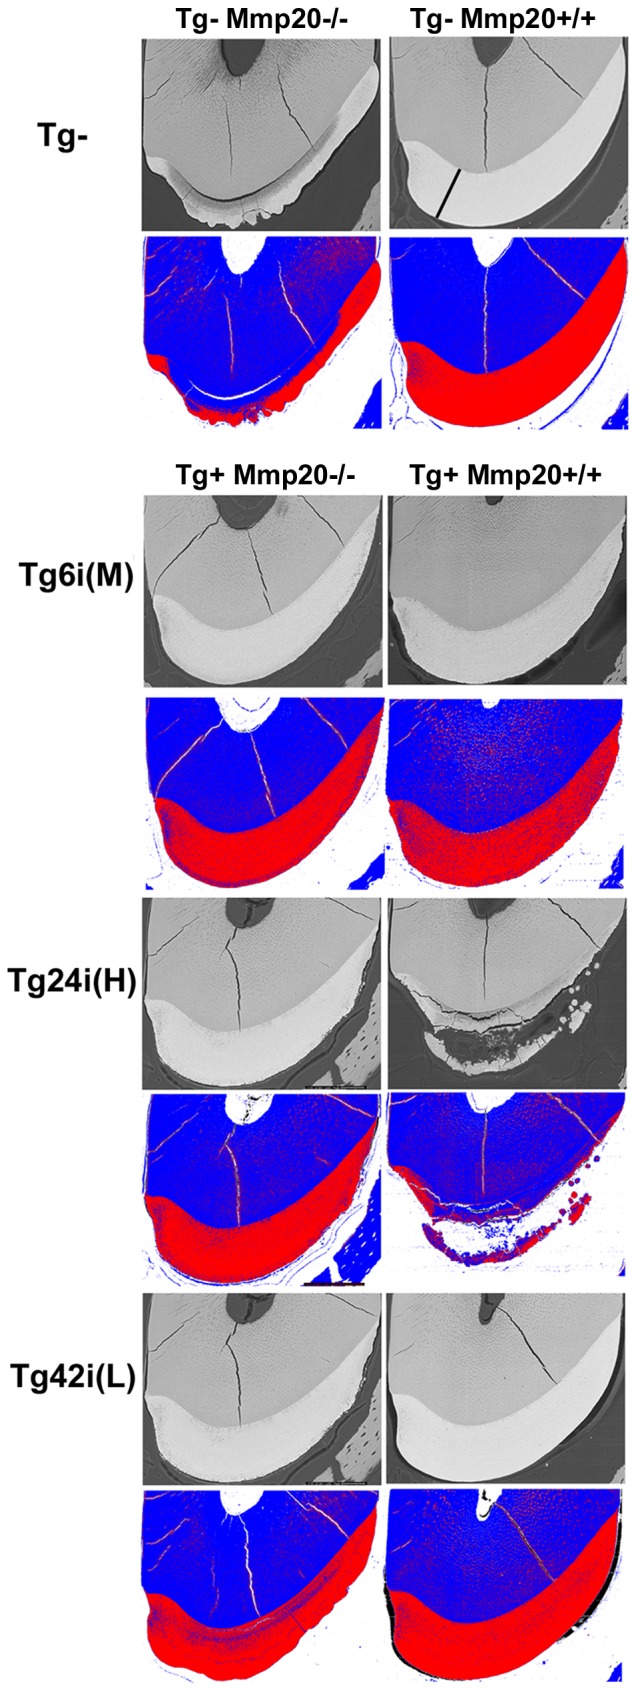
Figure 5. Assessment of incisor enamel mineralization by backscatter SEM and pseudo-color mapping.

Backscatter images of incisor cross sections were sectioned at a site located 8-color mapping of the image above. Color mapping allows easier visualization of differences in enamel mineralization within the enamel layer. Blue and white colors indicate decreased mineralization relative to the highly mineralized red color. For wild-type mice (Tg– Mmp20+/+), color mapping shows that enamel on the mesial (left) side is not quite as mineralized as is the rest of the enamel layer at this level of sectioning just prior to where the incisor erupts into the mouth. The Mmp20 null mouse (Tg– Mmp20–/–) enamel illustrates the variations in appearance of the enamel layer that is typical for these teeth. For transgenes in the Mmp20 null background, Tg6i (M) transgenic incisors had less mineralized enamel especially at the lateral (right) side and the surface. Tg24i (H) transgenic incisors showed similar results as well as an irregular enamel surface. Enamel from mice transgenic for Tg42i (L) in the Mmp20 null background had rougher surfaces and large areas of poor mineralization near the dentin-enamel junction. For the transgenes present in the Mmp20 wild-type background (Tg+ Mmp20+/+), the situation was reversed from what occurred in the Mmp20 null background. Mice transgenic for Tg6i (M) had poorly mineralized enamel throughout while Tg24i (H) transgenic mice had disorganized and clearly disrupted enamel formation. Conversely, the Tg42i (L) transgene in the wild-type background appeared relatively normal. In the top right panel, the black line extending from the dentin enamel junction to the outer edge of the enamel shows where enamel thickness measurements were obtained.
