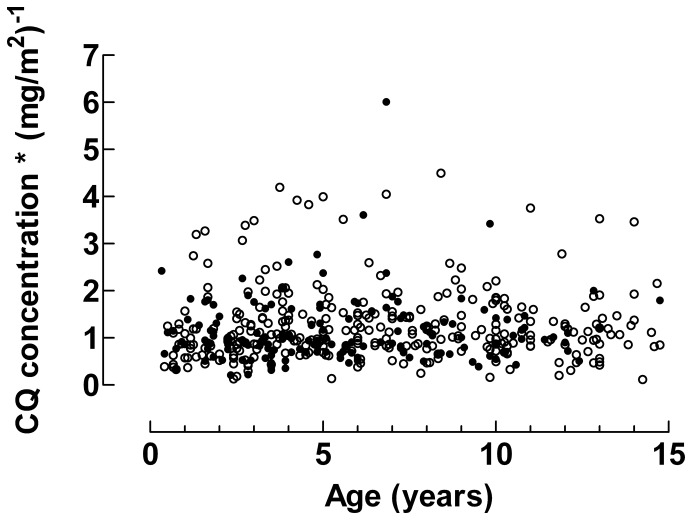
Figure 3. Chloroquine concentrations normalised for mg/m2.
The dose normalised CQ concentrations were independent of age. The solid line gives the median value of CQ concentrations normalised for mg/m2. Data from patients treated with 25 mg/kg of CQ are given by closed circles (•) and data from patients treated with 50 mg/kg of CQ are given by open circles (○).

