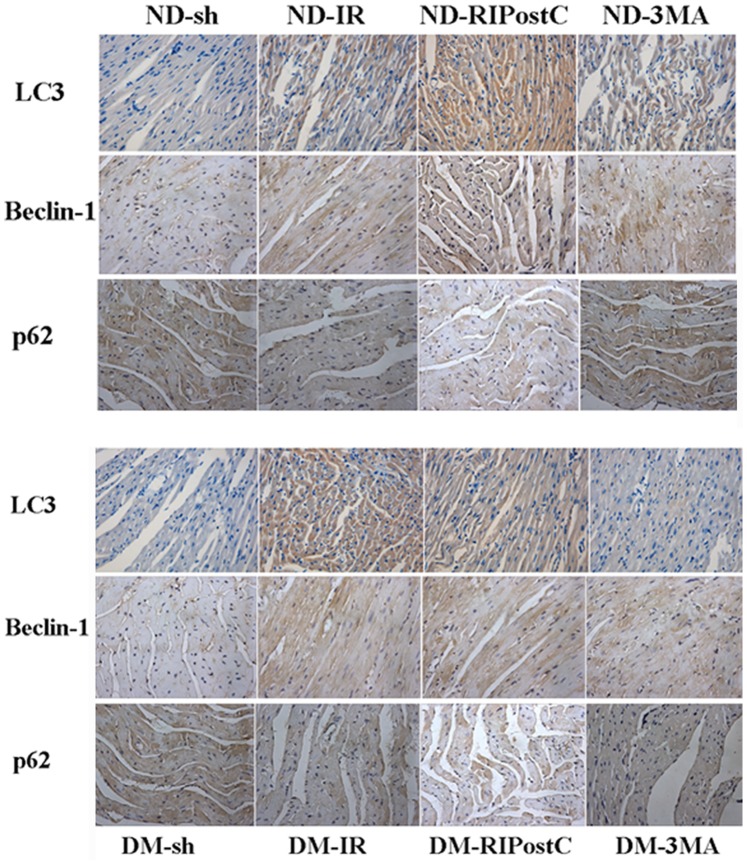
Figure 5. Immunohistochemical analysis of autophagy markers after RIPostC.
(A) immunohistochemical analysis was performed after 3 hours of reperfusion to test the expression of autophagic markers. (B–C) Bar graph showed the quantification of the autophagy markers. In the ND groups, RIPostC treatment markedly enhanced the expression of LC3 and Beclin-1, and decreased the level of SQSTM1/p62 compared with IR. (C) No significant difference was observed between DM-RIPostC and DM-IR. Original magnification: ×200. Figures are representative images of at least 4 experiments in each group.

