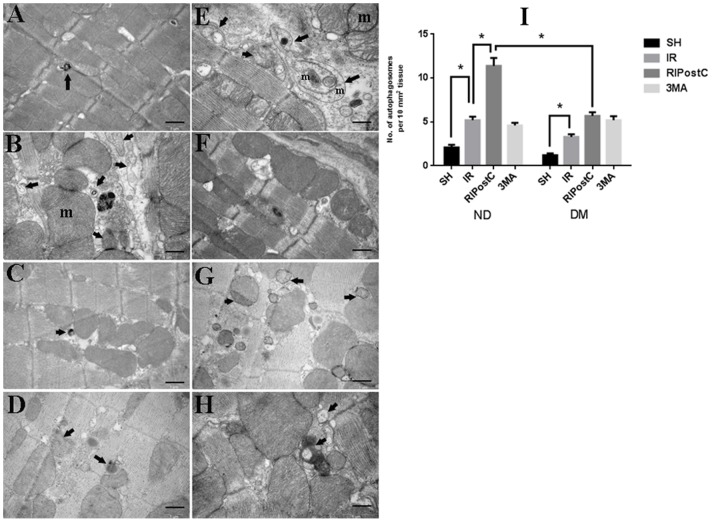
Figure 6. Transmission electron microscopy images to show the ultrastructural changes.
A: ND-sh, normal morphology without ultrastructural changes; B: ND-IR, a classic early autophagic vacuole (AV) with double limiting membrane (incompletely closure) containing mitochondria. C: ND-RIPostC, RIPostC-induced autophagosomes (arrows) formation with the characteristic morphology of autophagy and swelling mitochondria. D: ND-3MA, fewer autophagosome. E: DM-sh, normal morphology without ultrastructural changes. F: DM-IR, many autophagosomes contain mitochondria (m). G: DM-RIPostC, few autophagosomes. H: DM-3MA, few autophagosomes with double membrane (arrows) and mitochondrial swelling. Figures are representative images of five different heart samples. Data were presented as means ± SEM, n = 5 per group. *P<0.05 vs. the sh group; # P<0.05 vs. ND-IR and DM-RIPostC. Scale bar = 1 µm.

